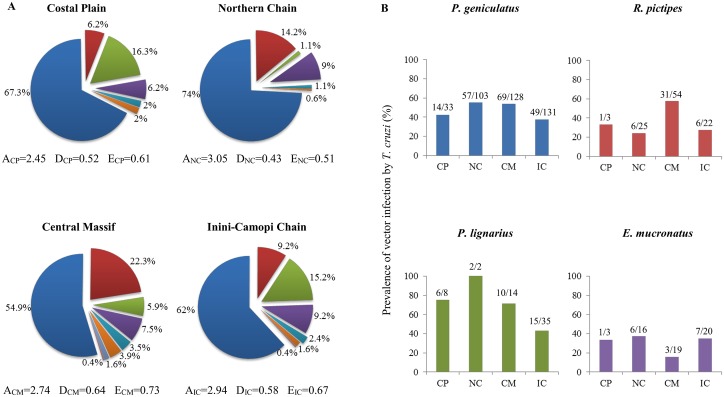
Fig 2. Geographical distribution of the biodiversity and infection of triatomine species in French Guiana.
(A) Biodiversity of triatomines. Numbers appearing inside circles refer to the average number of individuals collected per night for each species. A, D and E and refer to the overall Abundance (per night of collection), Diversity and Equitability of the vector community. (B) Infection of the four main species of triatomines. Numbers appearing above each bar refer to the number of bugs infected with T. cruzi and the number of bugs tested for infection. The colour legend used to refer to each triatomine species is the same as in Fig 1.

