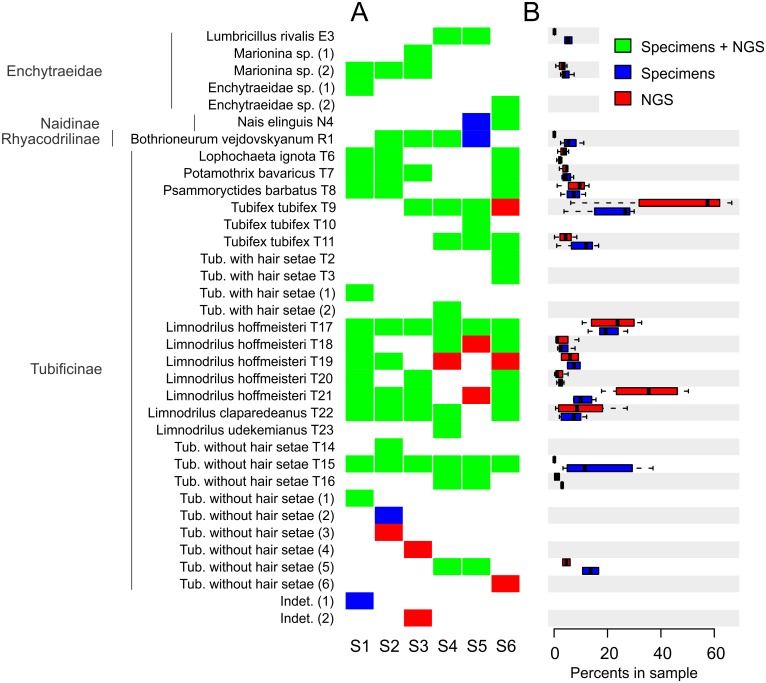
Fig 1. Detection of each OTU in the mixed samples by NGS.
A. The heatmap indicates if a taxon present in a mixed sample could be detected in the NGS data (green) or not (blue). The OTUs present in the NGS data of a given sample but not identified by Sanger sequencing are indicated in red. B. The boxplots display the proportions of specimen sequences (blue) and of NGS sequences (red) for each taxon sequenced in at least two mixed samples. OTUs designated by a letter followed by a number are known OTUs [20] and OTUs designated by a number in brackets are new; Indet = unidentified.

