FIGURE 3:
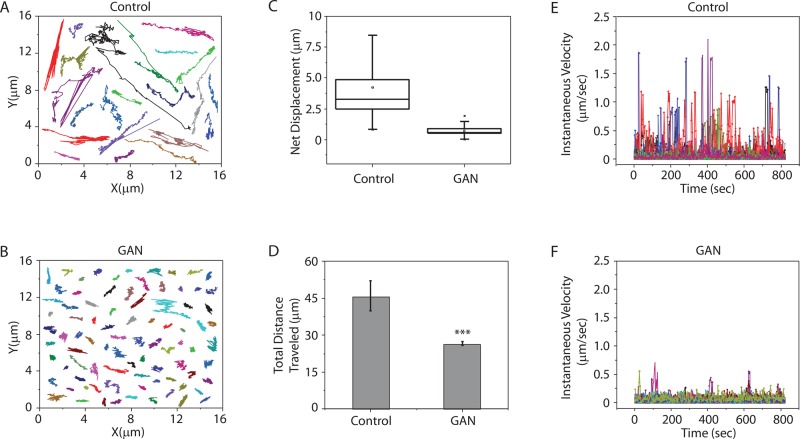
The motility of mitochondria is inhibited in GAN patient fibroblasts. Trajectories of individual mitochondria in control (A) and GAN patient (B) fibroblasts. (C) Box plot of net displacement of mitochondria in control and GAN patient fibroblasts. The box represents the 25th and 75th percentiles, the median is denoted by the horizontal line, the mean is indicated by a small dot, and whiskers indicate SD. (D) Bar graph shows the differences in the total distance traveled by mitochondria in control and GAN patient cells (p < 0.001). (E, F) Instantaneous velocities of individual mitochondria (different colors) were determined in control and GAN patient cells. A total of 90 mitochondria in GAN fibroblasts and 62 mitochondria in control cells were analyzed as described in Materials and Methods.

