FIGURE 6:
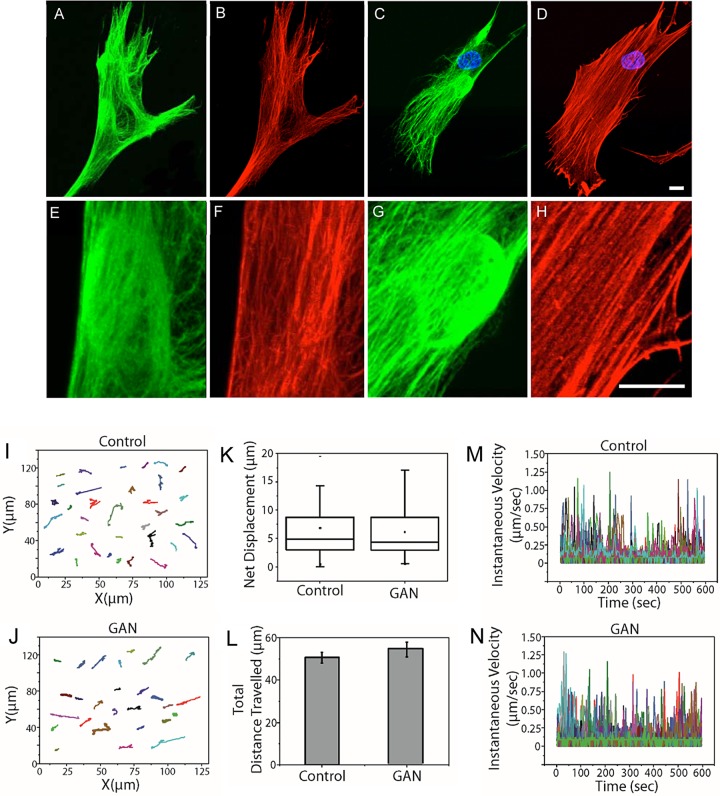
Lysosome motility is normal in GAN patient fibroblasts. (A, B) Double immunofluorescence showing that the overall organization of microtubules (red) appears normal in a GAN fibroblast (vimentin IFs; green). The juxtanuclear aggregate in A is shown at increased magnification, showing that microtubules are in close proximity to the aggregate (E, F). (C, D) The overall distribution of actin (red) appears normal in a GAN fibroblast (vimentin IFs; green). The juxtanuclear aggregate in C is shown at higher magnification to show that actin filaments and stress fibers are also in close proximity to the aggregate (G, H). Images are through-focus confocal stacks. Scale bars, 10 μm. (I, J) Trajectories of individual lysosomes in control and GAN patient fibroblasts show no detectable differences. (K) Box plot of net displacement of mitochondrial motility in control and GAN cells. The box represents 25th and 75th percentiles, the median is denoted by a horizontal line, the mean is indicated by a small dot, and whiskers indicate SD. (L) Bar graph shows the total distance traveled by lysosomes in control and GAN patient cells. (M, N) Instantaneous velocities of individual lysosomes in control and GAN patient cells (different colors represent individual mitochondria). Lysosomes were stained with LysoTracker Red, and their motility was assayed as described in Materials and Methods.

