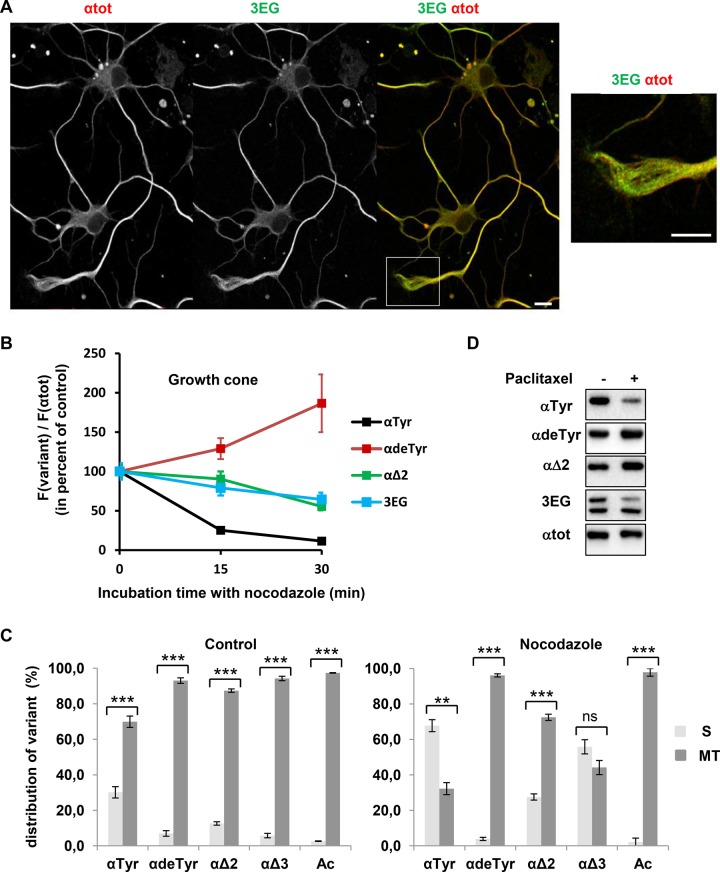
FIGURE 6:
Properties of neuronal 3EG-positive microtubules and tubulins. (A) Immunofluorescence study of the distribution of microtubules bearing αΔ3- and βΔ4-tubulin (3EG-positive microtubules) in hippocampal neurons cultured 2 DIV. Scale bar, 10 μm. Inset, magnification of the growth cone. Distribution of microtubules bearing the other α-tubulin variants is shown in Supplemental Figure S6. (B) Time course of nocodazole (20 μM) resistance of microtubules from 2 DIV hippocampal neurons analyzed in the growth cone (mean ± SEM). Microtubule fluorescence signals were measured for a minimum of 31 neurons at each time of drug treatment. The fluorescence signal of each tubulin variant, F(variant), was normalized to the total α-tubulin fluorescence signal, F(αtot), which is an index of the remaining microtubules, and then was plotted as percentage of the value obtained in the absence of nocodazole (time 0). (C) Immunoblot analysis of the distribution of α-tubulin species between soluble (S) and microtubular (MT) fractions in 7 DIV hippocampal neurons in the absence (left) or presence of 20 μM nocodazole for 30 min (right). The S and MT protein extracts from neuronal cultures (n = 3) were obtained as in Audebert et al. (1993). Results are shown as mean values ± SEM. ***p < 0.001 and **p < 0.01, t test. (D) Immunoblot of protein extracted from 7 DIV hippocampal neurons after incubation with DMSO (control) or paclitaxel (15 μM) for 2 h.

