FIGURE 1:
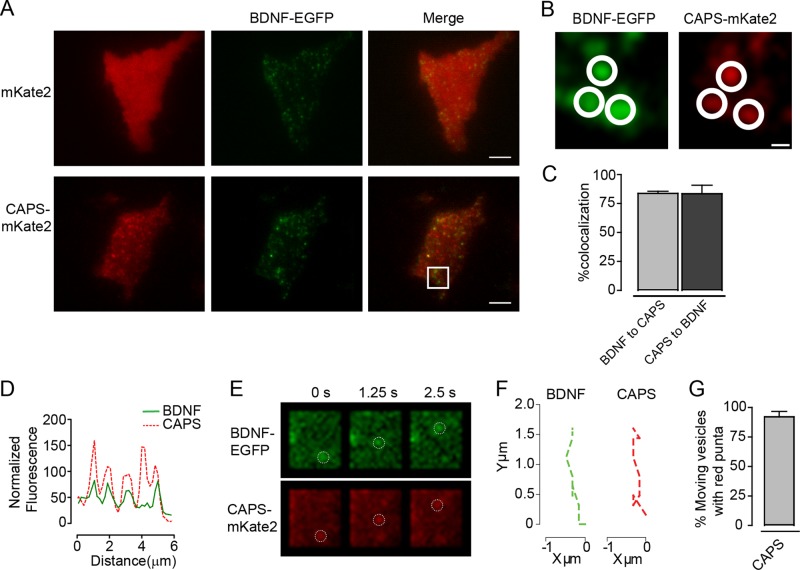
Colocalization of CAPS and DCVs in TIRF field. (A) TIRF images of PC12 cells expressing vesicle content BDNF-EGFP (green) and either mKate2 or CAPS-mKate2 (red). Scale bar, 5 μm. (B) Zoomed images are from the area outlined in the white box in A. Scale bar, 400 nm. Closed circles highlight areas of colocalization. (C) Percentage colocalization of DCVs and CAPS. Mean values ± SEM (n = 4 cells). (D) Random line scan (10 μm) of merged CAPS/DCV images. (E) TIRF images of moving DCVs (BDNF-EGFP) with CAPS-mKate2. Open circles highlight the moving DCVs in both channels. Scale bar, 1.5 μm. (F) Displacement graph plots trajectories of a moving DCV and a moving CAPS cluster. (G) Graph of percentage of moving DCVs that are associated with a moving cluster of CAPS-mKate2. Mean values ± SEM (n = 15–20 vesicles).

