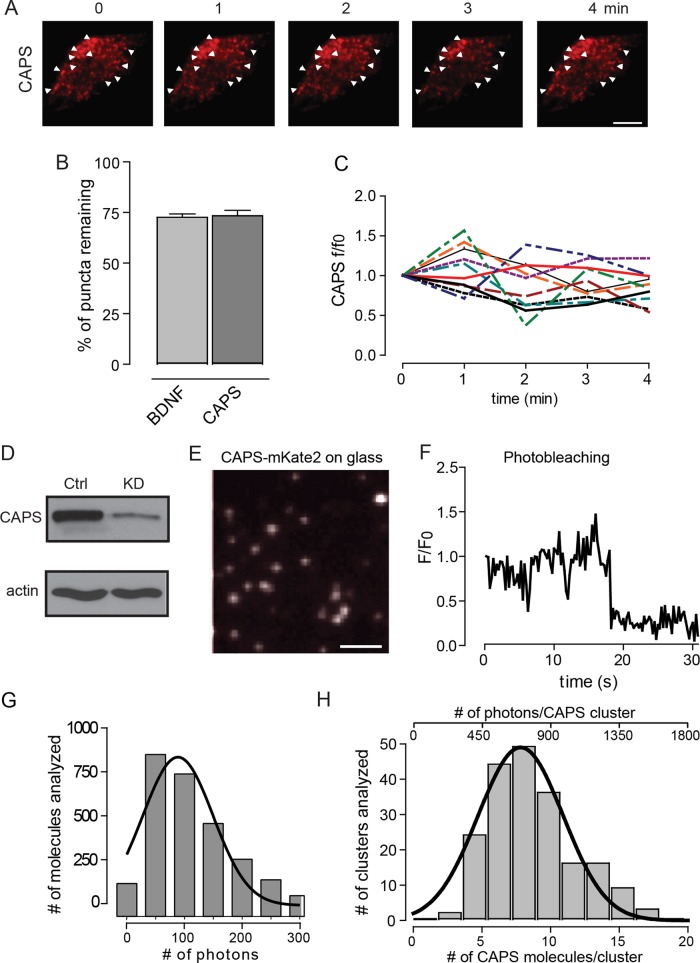
FIGURE 3:
Number of CAPS molecules present in clusters. (A) Live PC12 cell expressing CAPS-mKate2 imaged using TIRF in resting buffer for 4 min. White arrowheads point to clusters of CAPS that are present at all times. Scale bar, 5 μm. (B) Percentage of DCVs and CAPS that remain in the same position after 4 min. (C) Fluorescence intensity changes of 10 random CAPS clusters over the course of 4 min in resting cells. (D) CAPS shRNA was used to knock down CAPS in PC12 cells. (E) TIRF image of cytosol from CAPS-mKate2–expressing HEK cell diluted 1:250,000 and used as intensity standard. Scale bar, 400 nm. (F) Representative photobleaching step of a single CAPS-mKate2 molecule. (G) Histogram of the number of photons emitted by single CAPS-mKate2 molecules. Data were fitted to a single-Gaussian distribution with R-square = 0.91 (n = 2200 single molecules). (H) Histogram of the number of CAPS-mKate2 molecules present in a cluster at the time of fusion (bottom scale) or the photon distribution of clusters with background subtracted (top scale). Data for photons were fitted to a single-Gaussian distribution with R-square = 0.95 (n = 200 events in six cells).

