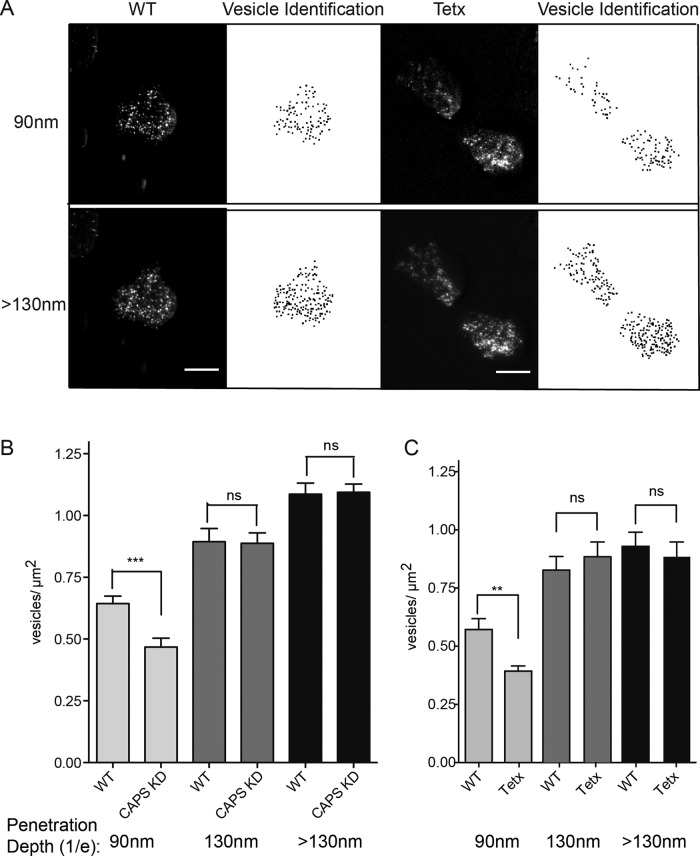
FIGURE 6:
Direct imaging of pools of attached DCVs in PC12 cells. (A) Representative image of wild-type or tetanus toxin light chain–expressing PC12 cell with BDNF-EGFP as DCV cargo imaged at TIRF angles corresponding to 1/e values of 90 or >130 nm (scale bar, 5 μm). Vesicle density was calculated from the binary images created through identification of local maxima above a background noise tolerance. (B) Quantitation of DCV density of wild-type or CAPS knockdown cells at penetration depths of 90, 130, and >130 nm (means ± SE, n ≥ 22 cells, ***p < 0.001). (C) Quantitation of DCV density of wild-type or tetanus toxin light chain–expressing cells at penetration depths of 90, 130, and >130 nm (means ± SE, n ≥ 25 cells; **p ≤ 0.01; ns, not significant). Similar results were obtained for botulinum neurotoxin D light chain–expressing cells.

