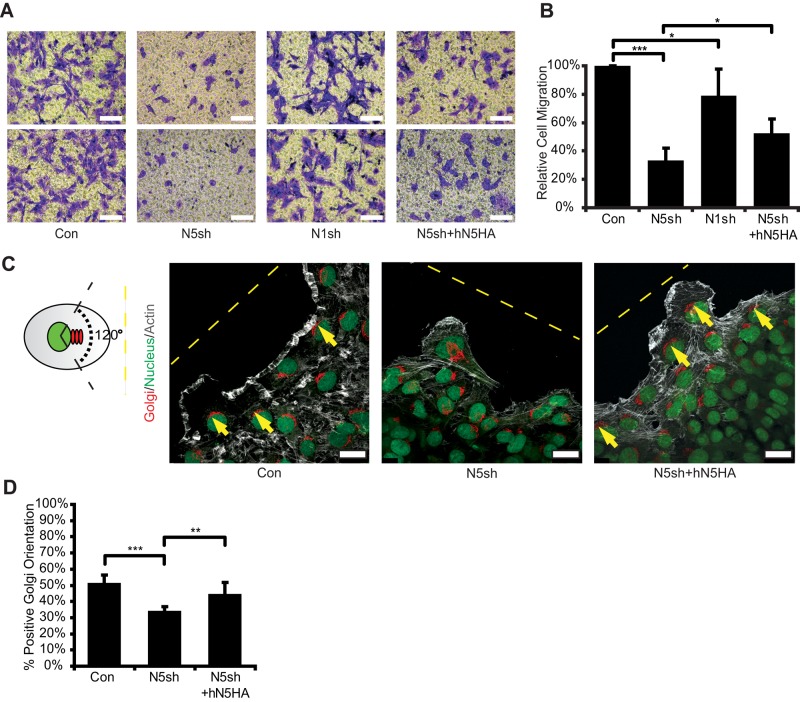
FIGURE 7:
NHE5 deficiency impairs cell migration and polarity. Cell migrations of C6 cells expressing shRNAs for scrambled (Con), NHE5 (N5sh) and NHE1 (N1sh), and N5sh cells expressing HA-tagged human NHE5 (N5sh+hN5HA) were analyzed by Transwell migration assays. Representative images of crystal violet staining of the Transwell membrane are shown in A. Scale bars: 500 μm. (B) Cells that migrated through the membrane were counted in five randomly selected microscopic fields and expressed as a percentage relative to those in control cells. Mean ± SD of 6–10 experiments. p Values were obtained by Tukey-Kremer test following ANOVA: F(3, 19) = 56.22, p < 0.0001; *, p < 0.05, ***, p < 0.001. (C) Control, N5sh, and N5sh+hN5HA cells migrating toward the open space introduced in the confluent monolayer were labeled with GM130 antibodies for Golgi (red), DRAQ5 for nucleus (green), and fluorescent phalloidin for F-actin (gray). Correct cell polarity is defined as the Golgi apparatus residing within a 120° angle of the migration axis. Representative confocal images are shown. Dashed lines indicate edges of wounds, and cells with correct orientation were marked. Scale bars: 25 μm. (D) Cells that displayed correct cell polarity were counted, and the number was divided by the total number of cells at the leading edge, using images as the unit of analysis. Bars represent mean (± SD) percentage of cells with correct polarity of a total of 13–18 images per cell line containing more than 50 cells in each image from two experiments. p Values were obtained by ANOVA: F(2, 2) = 11.19, p = 0.082, followed by Tukey-Kramer test; **, p < 0.01, ***, p < 0.001.

