FIGURE 2:
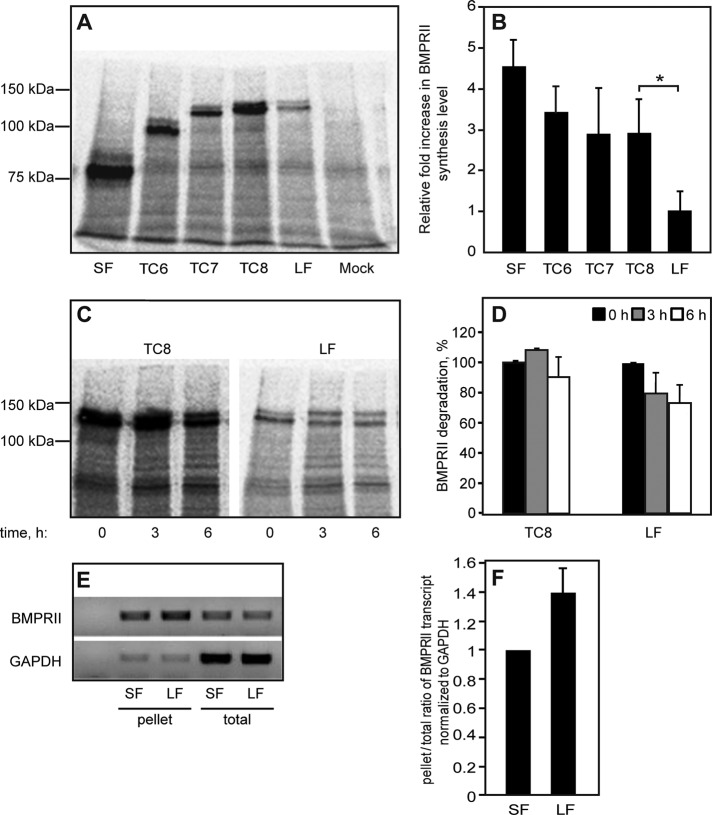
Determination of protein synthesis and degradation levels of BMPRII variants. (A–D) HEK293T cells were transfected with myc-BMPRII variants as in Figure 1. After 24 h, cells were washed, starved (30 min), and labeled (25 min) with [35S](Met+Cys). (A, B) Assessment of the synthesis of myc-BMPRII variants. After 35S labeling and lysis, the myc-tagged receptors were immunoprecipitated and subjected to SDS–PAGE, blotting, and autoradiography. (A) A representative experiment (one of four). The receptor appears as a doublet due to glycosylation, as the upper band disappeared upon PNGase F treatment (not shown). (B) Densitometric quantification. For each experiment, the intensity of the specific bands was calibrated relative to that of myc-BMPRII-LF, taken as 1. Bars are mean ± SEM of four experiments. The asterisk indicates a significant difference (p < 0.05) observed between TC8 and myc-BMPRII-LF. (C, D) Pulse-chase measurement of BMP receptor degradation. Cells transfected with the indicated myc-BMPRII constructs were pulse-labeled as described, chased for the indicated periods in nonradioactive complete medium, and subjected to immunoprecipitation, followed by blotting and autoradiography. (C) A representative gel. (D) Densitometric quantification. In each experiment (n = 3), the intensity of the band of each construct at time 0 (end of pulse) was taken as 100%. (E, F) Sucrose cushion assessment of mRNA recruitment to polysomes/ribosomes. HEK293T cells were transfected and processed as described in Sucrose cushion enrichment of polysomal/rRNA fraction. (E) A representative gel (n = 3) depicting the cDNA levels generated from the total mRNA and sucrose cushion–pelleted mRNA fractions. GAPDH cDNA levels in both fractions served as controls. (F) qRT-PCR quantification of pellet/total levels of BMPRII mRNA transcripts normalized to GAPDH mRNA. The ratio obtained for BMPRII-SF in each experiment was taken as 1.

