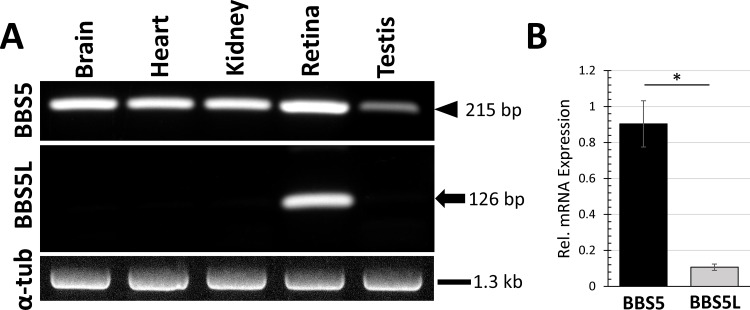
Fig 3. Reverse transcription-PCR amplification of Bbs5 and Bbs5L from various murine tissues.
(A) cDNA prepared from poly(A)+ RNA isolated from the five indicated tissues was amplified with primers specific for Bbs5 (upper panel; arrowhead indicates expected 215 bp product), Bbs5L (middle panel; arrow indicates expected 126 bp product), or alpha-tubulin for quality control (lower panel). (B) Quantitative RT-PCR was performed for Bbs5 and Bbs5L using cDNA prepared from retinal poly(A)+ RNA and quantified relative to levels of β-actin cDNA (n = 3; error bars indicate SEM; ρ<0.05).

