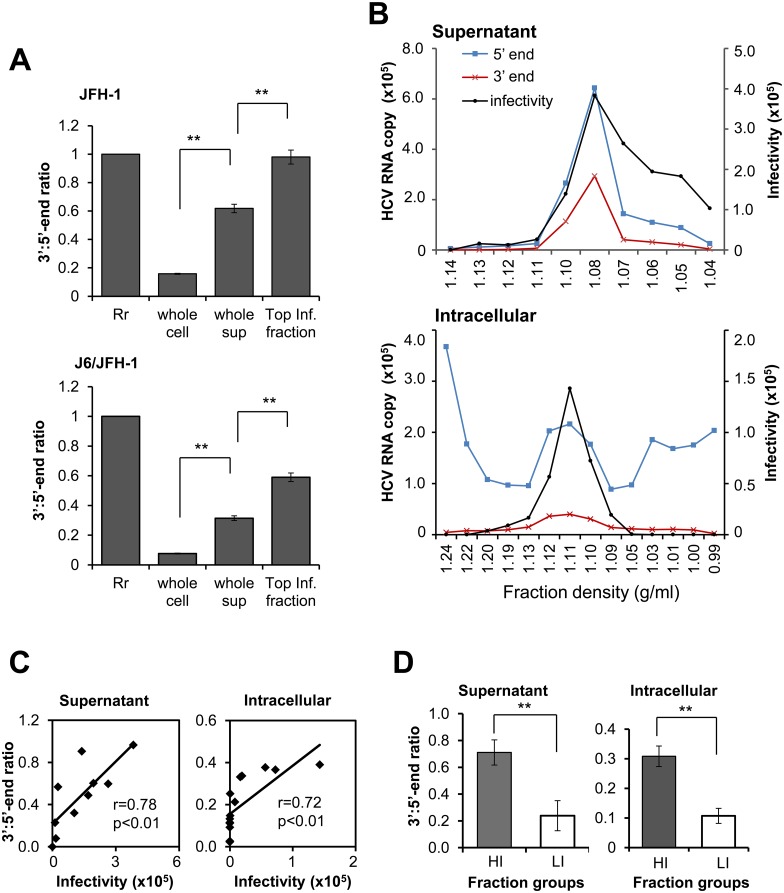
Fig 1. Characteristics of HCV RNAs in infected cells and culture supernatant.
(A) Normalized 3’:5’-end ratios of HCV RNA from cells (whole cell), supernatants (whole sup) and fractions with the highest infectivity (Top Inf. fraction) of cultures infected with HCVcc JFH-1 or J6/JFH-1. The ratio values calculated from NS5B (3’ end) and 5’ UTR (5’ end) qRT-PCR were normalized by the reference ratio (0.459; S1D Fig). The reference ratio was arbitrarily set to 1 (Rr) and the normalized 3’:5’-end ratios were shown. (B) Distribution of HCV RNA (5’ end, 3’ end) in fractions from culture supernatants and lysates of cells infected with HCVcc JFH-1, and the infectivity of each fraction. The y-axis indicates number of HCV RNA copies/ml (left) and infectivity in terms of viral RNA copies per μg of total RNA (right) from cells inoculated with equal aliquots of each fraction. Infectivity was measured by quantification of HCV RNA in the infected cells, 2 days post-infection. Blue, red and black lines represent quantity of 5’ end, 3’ end and infectivity, respectively. (C) Correlation of 3’:5’-end ratios with infectivity of the fractions obtained from supernatant and cells following HCVcc (JFH-1) infection as shown in (B). Correlations were estimated by way of linear regression and statistical significance was set at P = 0.01. (D) Comparison of 3’:5’-end ratios of high infectious (HI) and low infectious (LI) fractions. The median value of the infectivity of the fractions was used to split the fractions into HI and LI groups. Fractions derived from JFH-1, as shown in Fig 1B were used. Values are the mean ± SEM (n = 4 for whole cell and whole sup; n = 2 for Top Inf. fraction, n = 5 for supernatant HI and LI fraction groups and n = 7 for intracellular HI and LI fraction groups); ** P<0.01, Student’s t test.

