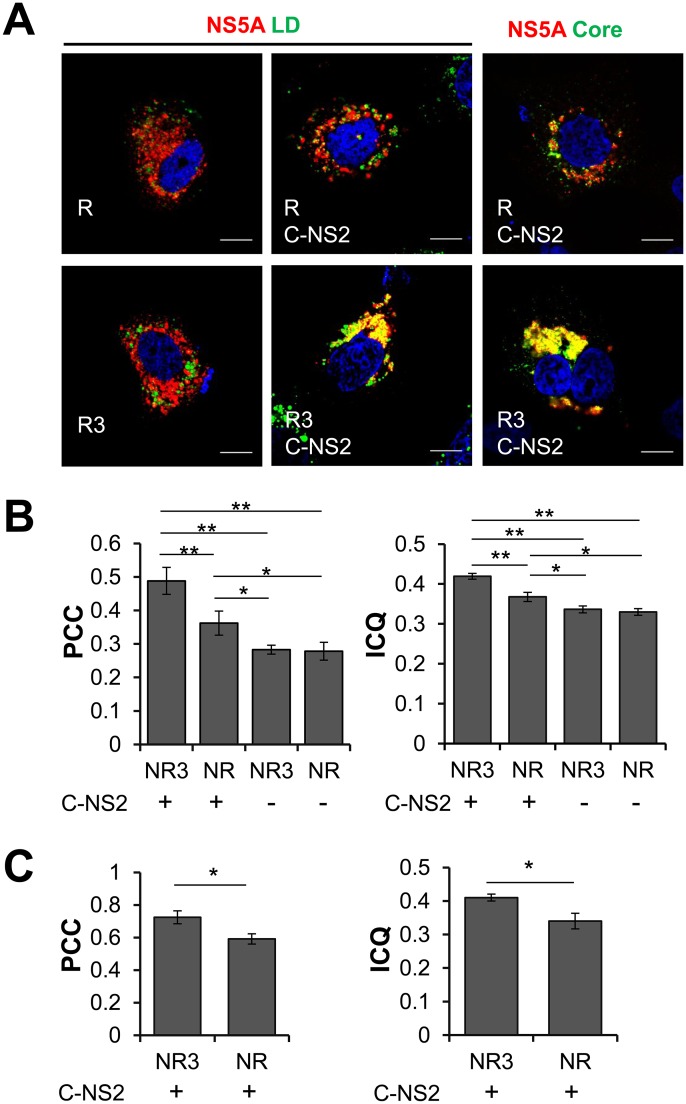
Fig 4. (A) Subcellular localization of NS5A (red), counter stained with LD (green in left and middle panels) or with Core (green in right panels).
Huh7.5.1 cells were co-transfected with pCAG/NS3-5B, pRluc (R) or pRluc-3’UTR (R3), together with pCAG/C-NS2 (C-NS2) (middle and right panels) or an empty vector (left panel), and were immunostained for NS5A, Core and LD at 48 hr post-transfection. Scale bars represent 20 μm. Co-localization between NS5A and LD (B) or NS5A and Core (C) was assessed by Pearson’s correlation coefficient (PCC) and intensity correlation quotient (ICQ) analyses. For each group, co-localization was analyzed in 30 cells. N: pCAG/NS3-5B, R: pRluc, encoding Rluc; R3: pRluc-3’UTR, encoding Rluc followed with 3’ UTR of JFH-1. Data were present as mean ± SEM, n = 30. * P<0.05, ** P<0.01, Student’s t test.

