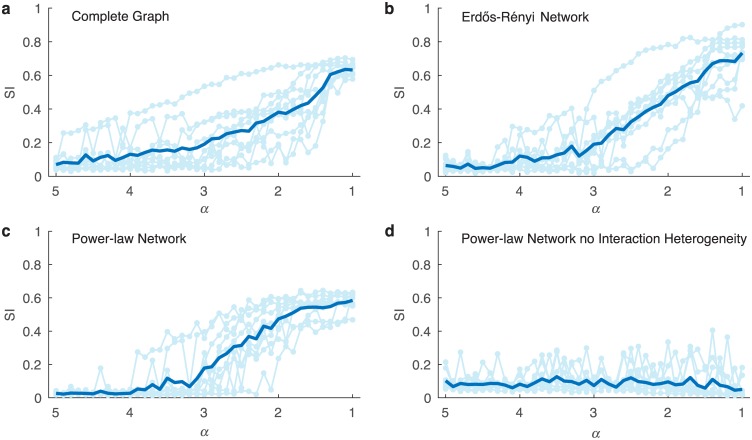
Fig 4. Impact of network structure on the distinctness of community types.
For each type of network structure 10 different Universal Triples (S, A, r) with n = 100 species and q = 500 local communities of size p = 80 were generated with results shown in the lighter color and averaged results shown in bold. (a) Complete graph. Same study as in Fig 2 with α ∈ [5, 1). (b) Erdős-Rényi network (digraph) , where α ∈ (1, 5], Probability [G]ij = 1 is 0.1, i.e. a mean in(out)-degree of 10, and scaling factor . (c) Power-law out-degree network , , G is the adjacency matrix for a digraph with out-degree having a power-law distribution . The high-degree nodes have the largest interaction scaling. (d) Power-law out-degree network, no interactions strength heterogeneity , H is the identity matrix, G is the adjacency matrix for a digraph with out-degree having a distribution . Further details can be found in Materials and Methods.

