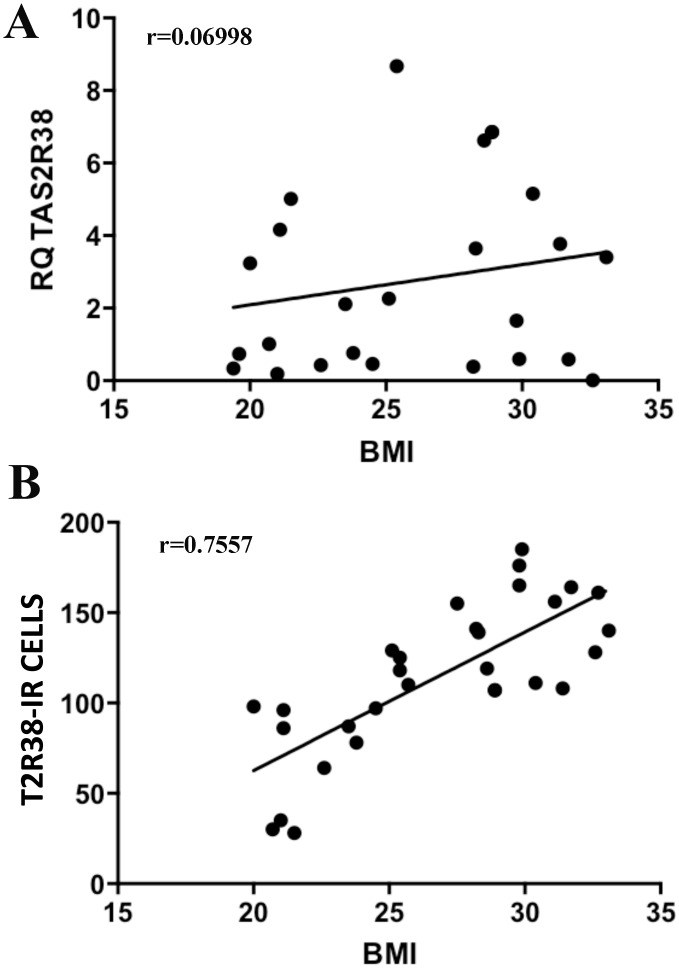
Fig 2. Graphical representations of Spearman Correlation (r) test.
Spearman correlation test was performed between T2R38 expression and BMI in the subjects included in this study. There was no significant correlation between T2R38 mRNA levels and BMI values (A) (r = 0.06998; P = 0.7694), but there was a highly significant and positive correlation between the density of T2R38-IR cells and BMI values (B) (r = 0.7557; P = 0.001).

