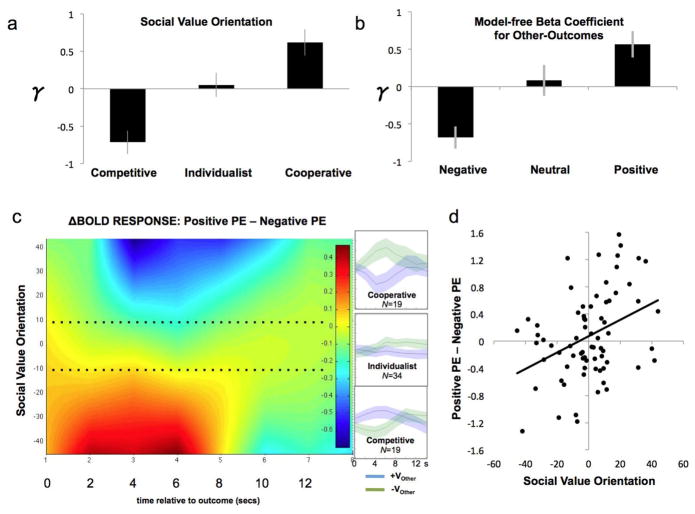
Fig. 4. Prediction error for “Other Values” (VO).
(a) We divided the group of the 72 participants into three groups based upon an independent assessment of Social Value Orientation (see Methods). In this separate task, participants chose between allocations of an endowment between oneself and an anonymous social partner, thus revealing the Cooperative, Individualistic, or Competitive orientation of each participant. We used the mean SVO ± ½ std. deviation as boundary criterion. For each SVO-determined group, the average γ (i.e., fitted parameter determining social preferences in the hybrid learning model) is plotted on the y-axis. Positive γ is consistent with a cooperative orientation, while negative γ is consistent with a competitive orientation.
(b) For each subject we tested a binary logistic regression model with the ‘outcome to self’ and ‘outcome to other’ received on the previous trial as predictors; the choice (stay or switch) in the present trial as the dependent variable. We then created three groups based on the estimated betas associated with VO, using the mean beta value ± ½ std. deviation as boundary criterion. Positive beta values correspond to a higher probability of choosing “stay” when VO of the previous trials is positive. The average γ (i.e., fitted parameter determining social preferences in the hybrid learning model) is plotted on the y-axis for each group.
(c) Differential BOLD response to positive and negative PE as a function of Valence, Social Value Orientation and time. X-axis represents time since onset of outcome screen. Y-axis represents Social Value Orientation. The heatmap represents fitted BOLD response to positive PE minus negative PE in 72 subjects. To facilitate comparison, we multiplied the PEO-related hemodynamic response by each decision-maker’s γ, thus transforming the PEO signal to the perspective of the ‘other’ social partner. Thus, the positive PEO of the cooperative decision-maker (better than expected from the perspective of ‘other’) becomes comparable to the negative PEO of the competitive decision-maker (again, better than expected from the perspective of ‘other’). Insets on the right depict peristumulus time histograms to positive and negative PE for the three groups. Dotted line represents the boundaries separating the three groups.
(d) Correlation (r = .37; P < .005) between social value orientation (X-Axis) and difference in BOLD response 4 secs after the onset of the outcome screen (Y-axis).

