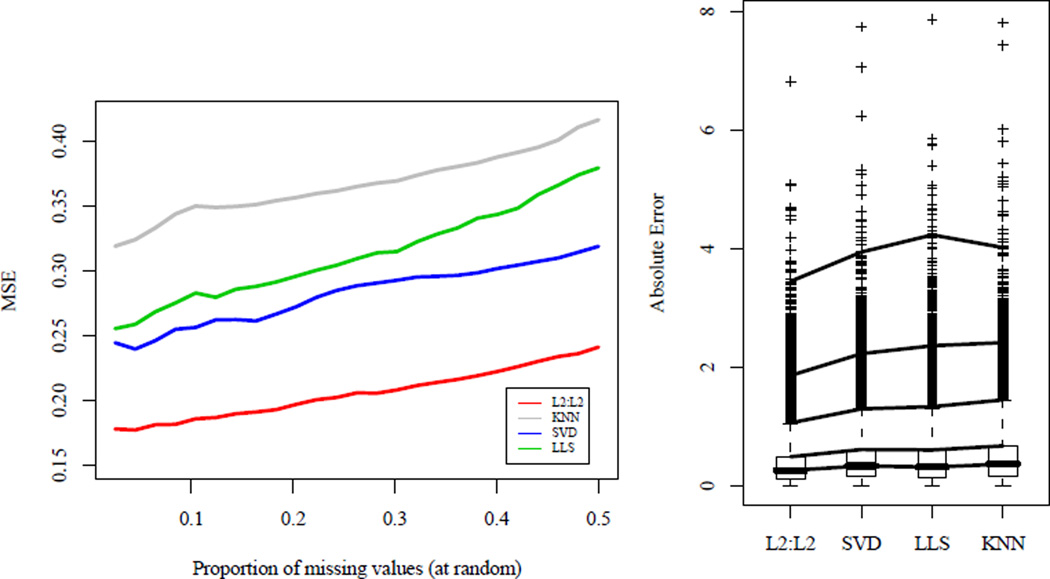
Fig 2.
Left: Comparison of MSE for imputation methods on kidney cancer microarray data with different proportions of missing values. Genes in which all samples are observed are taken with values deleted at random. TRCMAimpute, L2 : L2 and common imputation methods KNNimpute, SVDimpute and LLSimpute are compared with all parameters chosen by 5-fold cross-validation. Cross-validation chose to penalize only the arrays for the one-step approximation algorithm, TRCMAimpute. Right: Boxplots of individual absolute errors for various imputation methods. Genes in which all samples are observed were taken and deleted in the same pattern as a random gene in the original dataset. Lines are drawn at the 50%, 75%, 95%, 99%, and 99.9% quantiles. TRCMAimpute, L2 : L2 has a mean absolute error of 0.37 and has lower errors at every quantile than its closest competitor, SVDimpute which has a mean absolute error of 0.46.

