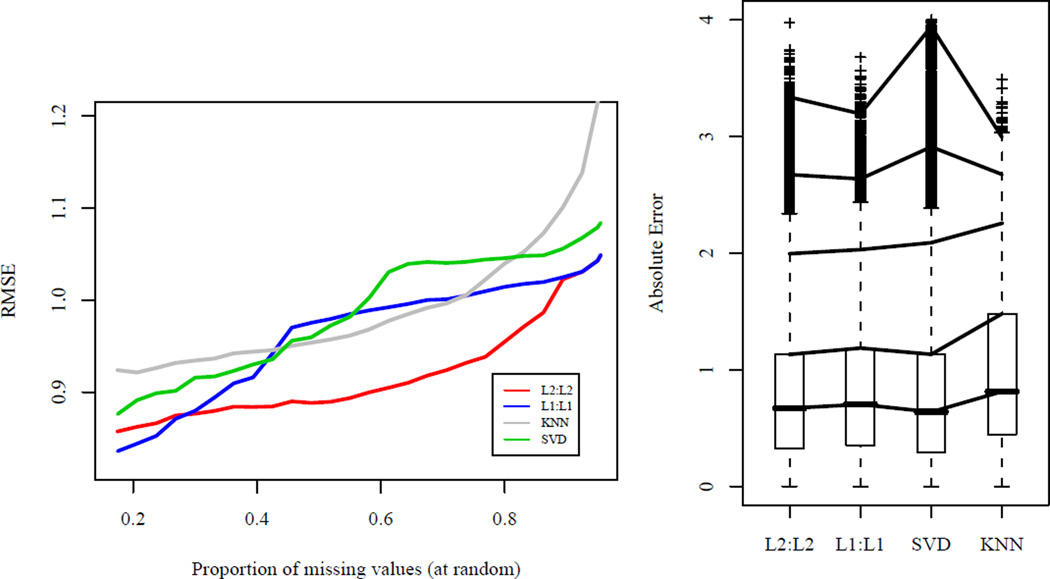
Fig 3.
Left: Comparison of the root MSE (RMSE) for a subset of the Netflix data for TRCMAimpute, L2 : L2 and L1 : L1, to KNNimpute and SVDimpute. A dense subset was obtained by ranking the movies and customers in terms of number of ratings and taking the top 250 movies and 250 customers. This subset has around 12% missing and additional values were deleted at random, up to 95%. With 95% missing, the RMSE of TRCMAimpute is 1.049 compared to 1.084 of the SVD and 1.354 using the movie averages. Right: Boxplots of absolute errors for the dense subset with missing entries in the pattern of the original data. Customers with at least one ranking out of the 250 movies were selected at random and entries were deleted according to these customers leaving 74% missing. Quantiles of the absolute errors are shown at 50%, 75%, 95%, 99%, and 99.9%. The RMSE of the methods are as follows L2 : L2: 1.005, L1 : L1: 1.029, SVD: 1.032, KNN: 1.184.

