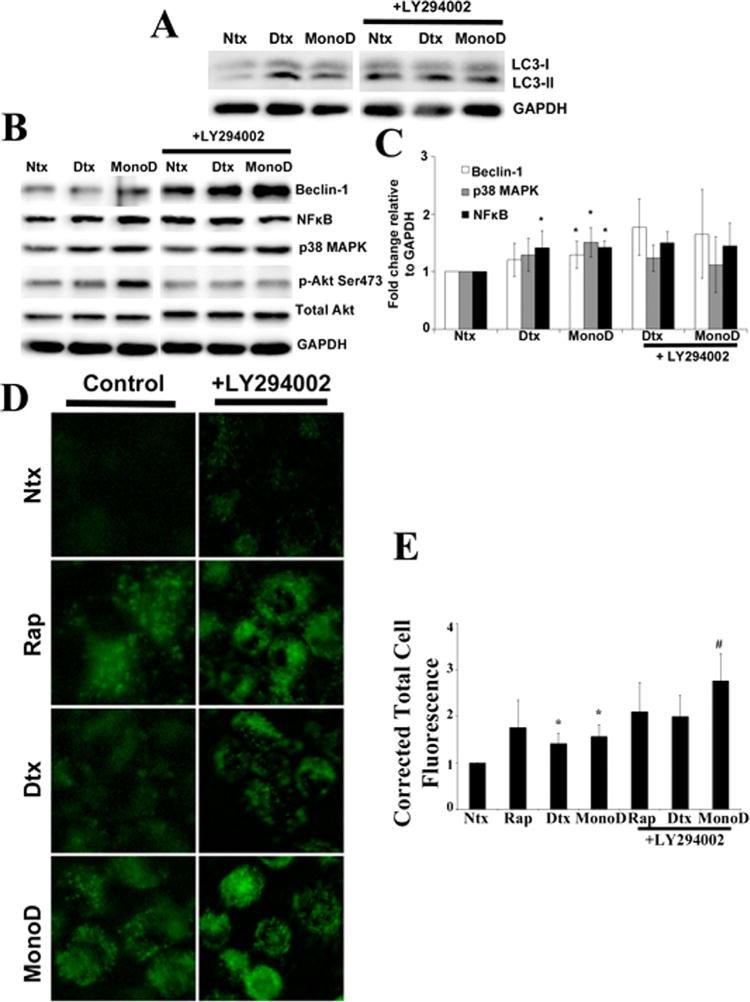
Fig. 6.

Akt inhibits MonoD-induced autophagy. A: Cells were pretreated for 1 h with Akt inhibitor LY294002 (20 μM), followed by 50 nM Digitoxin and MonoD for 1 h. Forty micro gram cell lysate was separated on a 10% SDS–PAGE followed by immunoblotting and probed for autophagy marker LC3-II. Please note the control lanes Ntx,Dtx, and MonoD were a part of a combined experiment with Bcl2-inhibitor and are the same as in Figure 4E. B: Lysates obtained as described in Figure 5A were probed for autophagy regulatory proteins Beclin-1, NFkB, and p38 MAPK and quantified as described earlier. Please note the control lanes Ntx, Dtx, and MonoD were a part of a combined experiment with Bcl2-inhibitor and are the same as in Figure 4F. C: Beclin-1, NF-κB, and p38 MAPK blots were quantified with densitometry using ImageJ. D: Cells were pretreated for 1 h with Akt inhibitor LY294002 (20 μM), followed by 50 nM Digitoxin and MonoD for 1 h. Autophagic fluorescence was visualized using Cyto-ID1 autophagy detection kit. E: Autophagic vacuoles were quantified using ImageJ analysis software after performing background subtraction and plotted as Corrected Total Cell Fluorescence. (*P < 0.05 versus untreated control; #P < 0.05 versus MonoD-treated dataset)
