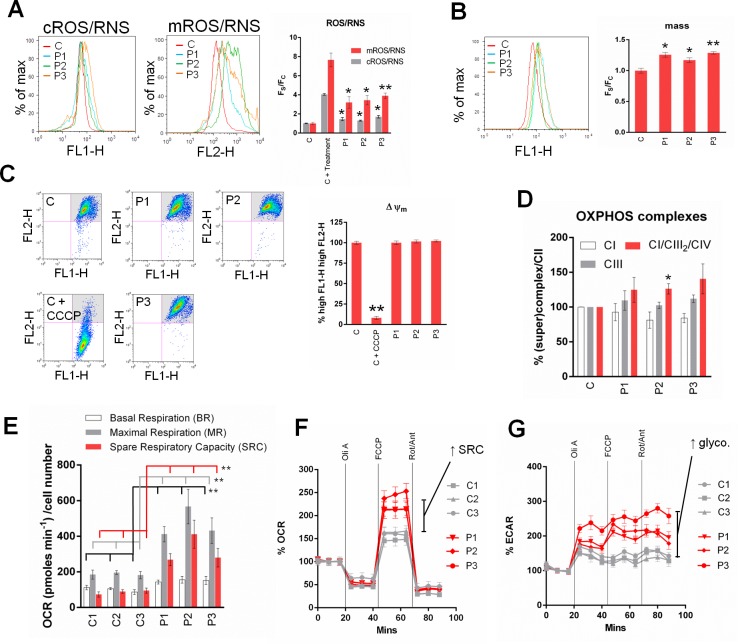
Fig 5. adck3 mutant cells display changes in mitochondrial homeostasis and OXPHOS remodelling.
(A). adck3 mutant fibroblasts display a significant increase in cROS/RNS and mROS/RNS production. Analysis of cellular (cROS/RNS) and mitochondrial (mROS/RNS) ROS/RNS levels in control and adck3 mutant fibroblasts under basal conditions. Cells stained with either 1 mM CM-H2-DCFDA (cROS/RNS) or 5 μM mitoSOX (mROS/RNS) and analysed via flow cytometry. C + treatment: 200 μM H2O2 (cROS/RNS) or 100 μM Antimycin A (mROS/RNS) for 1hr prior to staining with probes. Results are expressed as Mean Fluorescence Intensity divided by mitochondrial mass ((FS), also see B) and normalised to control values (FC). All data are from 3 independent experiments ± S. E. M. A representative histogram from flow cytometry is shown. (B). Mitochondrial mass is elevated in adck3 mutant fibroblasts. Cells were stained with 1 μM NAO under basal conditions and analysed via flow cytometry. Results are expressed as Mean Fluorescence Intensity (FS) from 3 independent experiments (normalised to control values (FC)) ± S. E. M. A representative histogram from flow cytometry is shown. (C). ΔΨm is unaffected under basal conditions in adck3 mutant cells. Control and adck3 mutant fibroblasts were stained with JC-1 under basal conditions and analysed via flow cytometry. Results are expressed as % of cells with high FL1-H, high FL2-H signal (see grey shaded quadrant in representative dot plots) observed from 3 independent experiments ± S. E. M. (D). Analysis of OXPHOS (super)complex stability in control and adck3 mutant cell lines. Isolated mitochondria solubilised in 1% Triton-X100 or 1% Digitonin prior to BN-PAGE and immunoblotting with anti-NDUFA9 (CI), anti-70 kDa (CII) and anti-Core I (CIII) (See S7 Fig). All data normalised to control values ± S. E. M. n = 3. (E, F, G). adck3 mutant cells display an increase basal OCR and spare respiratory capacity. Oxygen consumption rate (OCR—F) and Extracellular Acidification Rate (ECAR—G) measurements in control and adck3 mutant cells were acquired with a Seahorse Biosciences XF24 Analyzer. 20,000 cells per well. Oli (1 μM Oligomycin), FCCP (1 μM), Rot/Ant (1 μM Rotenone/Antimycin A). n = 3. Experimental values normalised to %OCR/ECAR in F, G. Raw data (OCR pmoles min-1 cell number-1) depicted in histogram presented in E. * p < 0.05; ** p < 0.005 (compared to control group) using Student’s t-test in (A, B, C) and Wilcoxon Mann Whitney test in (E).

