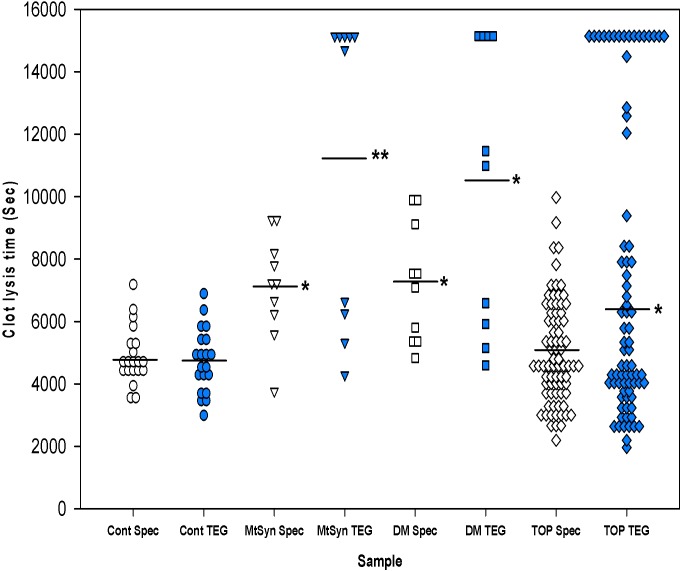
Fig 1. Dot plot of clot lysis time values for each patient.
Horizontal lines represent the mean of each group. Abbreviations: Cont-apparently healthy control patients; TEG-thromboelastography; MtSyn- metabolic syndrome; DM-diabetes mellitus; Spec-spectrophotometry (turbidimetric method); TOP-TOPCOAT. *p < 0.05 vs. control, **p < 0.01 vs. control, ANOVA with Dunnett’s post-hoc.

