
Fig 1. Interaction of HD-PTP(1–361) with the STAM2 core region.
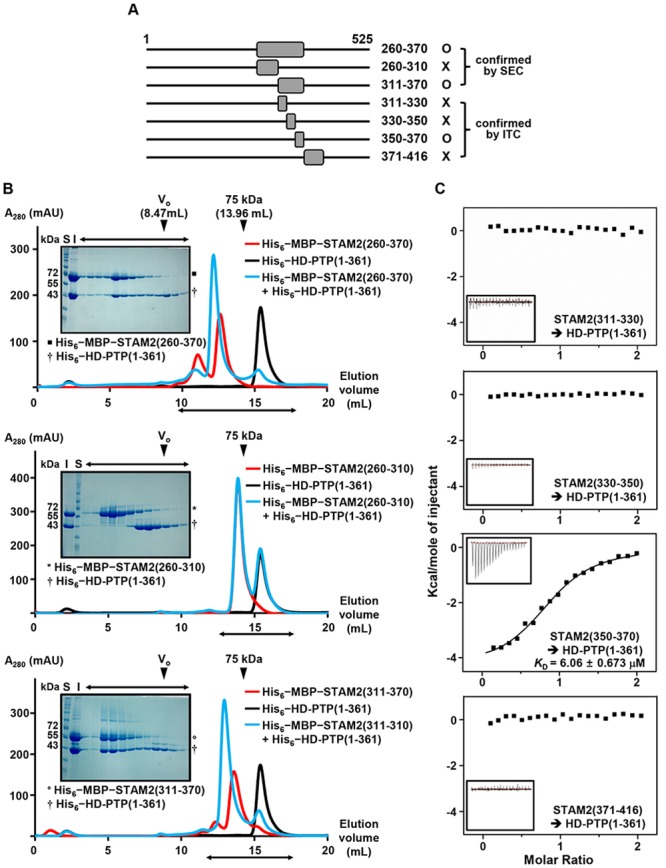
(A) STAM2 constructs tested for binding to HD-PTP(1–361). Denoted beside the residue numbers is whether each construct interacted with HD-PTP(1–361) (B) SEC analysis results using a Superose 6 10/300 GL gel filtration column. The elution positions of standard protein size markers Blue dextran (void volume, V0) and Conalbumin (75 kDa) are indicated by arrowheads. The proteins tested in each analysis are denoted (Right). The peak fractions from the HD-PTP and STAM2 mixture elution were analyzed and visualized by SDS-PAGE and Coomassie staining (Left). S, size marker; I, input. (C) ITC analysis. Each 0.5 mM STAM2 peptide was titrated into 50 μM HD-PTP(1–361). The KD value was deduced from curve fittings of the integrated heat per mole of added ligand.