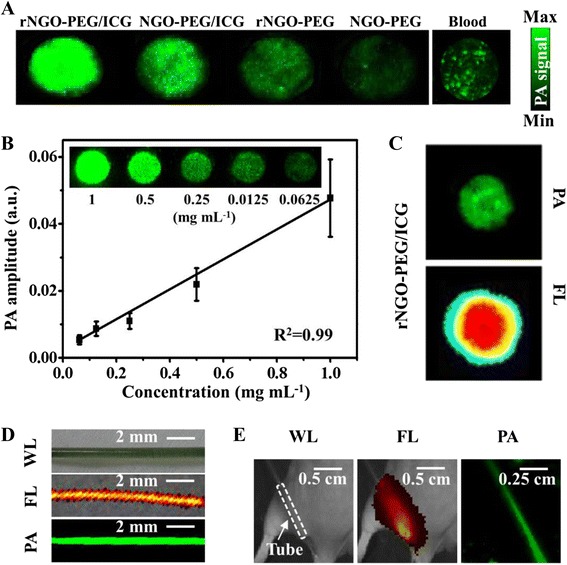
Fig. 4.

Photoacoustic (PA) imaging of various phantom samples, as well as comparisons between photoacoustic and fluorescence (FL) imaging. a Photoacoustic images of NGO-PEG, rNGO-PEG, NGO-PEG/ICG, and rNGO-PEG/ICG with the same GO concentration and whole blood. b The linear relationship between PA signal intensity and the concentration of rNGO-PEG/ICG. Inset: Photoacoustic images of various concentrations of rNGO-PEG/ICG. c Photoacoustic and FL images of rNGO-PEG/ICG covered with 5-mm-thick agarose gel containing 0.5 % intralipid. d White light (WL), FL, and PA MAP images of a PE tube filled with rNGO-PEG/ICG. e White light, FL, and PA MAP images of a mouse with the rNGO-PEG/ICG filled PE tube implanted subcutaneously at the dorsal aspect of the leg. The white dash box indicates the location of the tube
