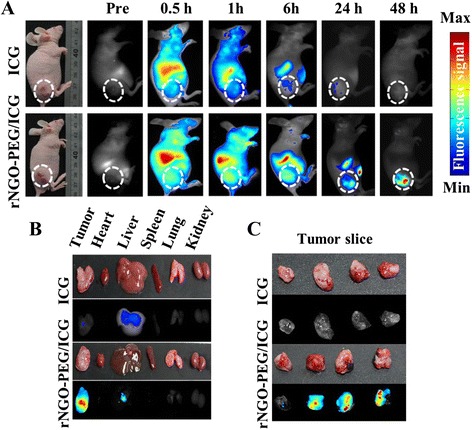
Fig. 5.

In vivo fluorescence imaging. a Fluorescence signal distribution within the tumor-bearing mouse body as a function of time after tail vein injection of ICG and rNGO-PEG/ICG. White dash line encircles the tumor region. b, c The ex vivo fluorescence signal of the excised major organs (tumor, heart, liver, spleen, lung, and kidney) and tumor slices of mice at 48 h post injection
