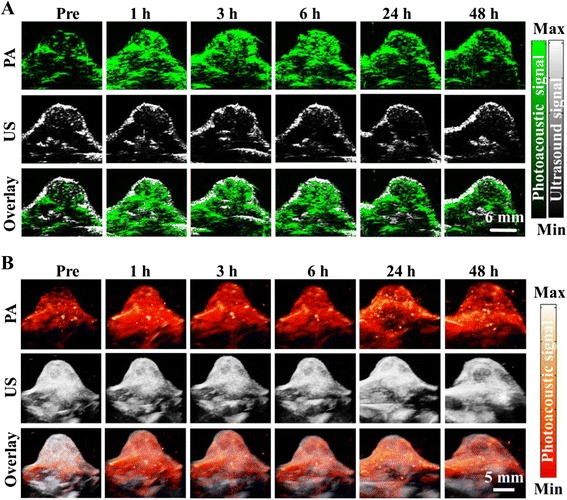
Fig. 6.

In vivo photoacoustic imaging. a B-scan and b 3D ultrasound (US) and PA images of the tumor region obtained at 1, 3, 6, 24, and 48 h post tail vein injection of rNGO-PEG/ICG. The US images delineated the skin and tumor boundaries, while the PA images showed the accumulation and distribution of the nanocomposite within the tumor region
