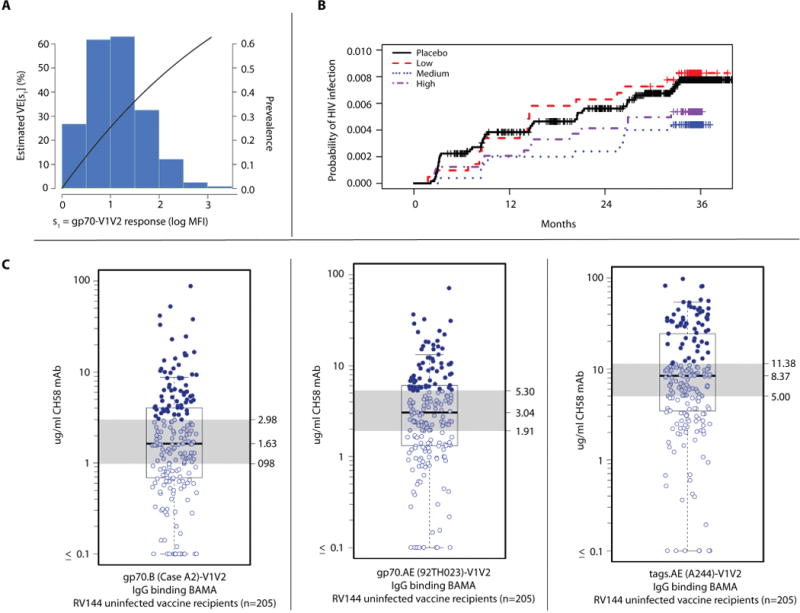
Figure 2. Estimated vaccine efficacy in RV144.

Estimated vaccine efficacy in RV144 as a function of the level of IgG binding antibody to gp70-scaffolded V1V2 in a model assuming VE of 0% in vaccinees with no V1V2 antibodies (black line) and the distribution of IgG levels among vaccinees (histogram) (Panel A). Kaplan-Meir curve of the probability of acquiring HIV infection in vaccine recipients with Low, Medium and High V1V2-scaffold IgG Ab responses, measured by BAMA at Week 26 (Panel B). The median, upper, and lower bounds of antibody concentrations to 3 of the V1V2 antigens that were correlated to vaccine efficacy: the left panel shows the cross-clade clade B gp70 levels; the middle panel the V1V2 response to the AE isolate in the ALVAC vector used in RV144; and the third panel shows the V1V2 responses to the AE gp120 used in the protein boost in RV144 (Panel C).
