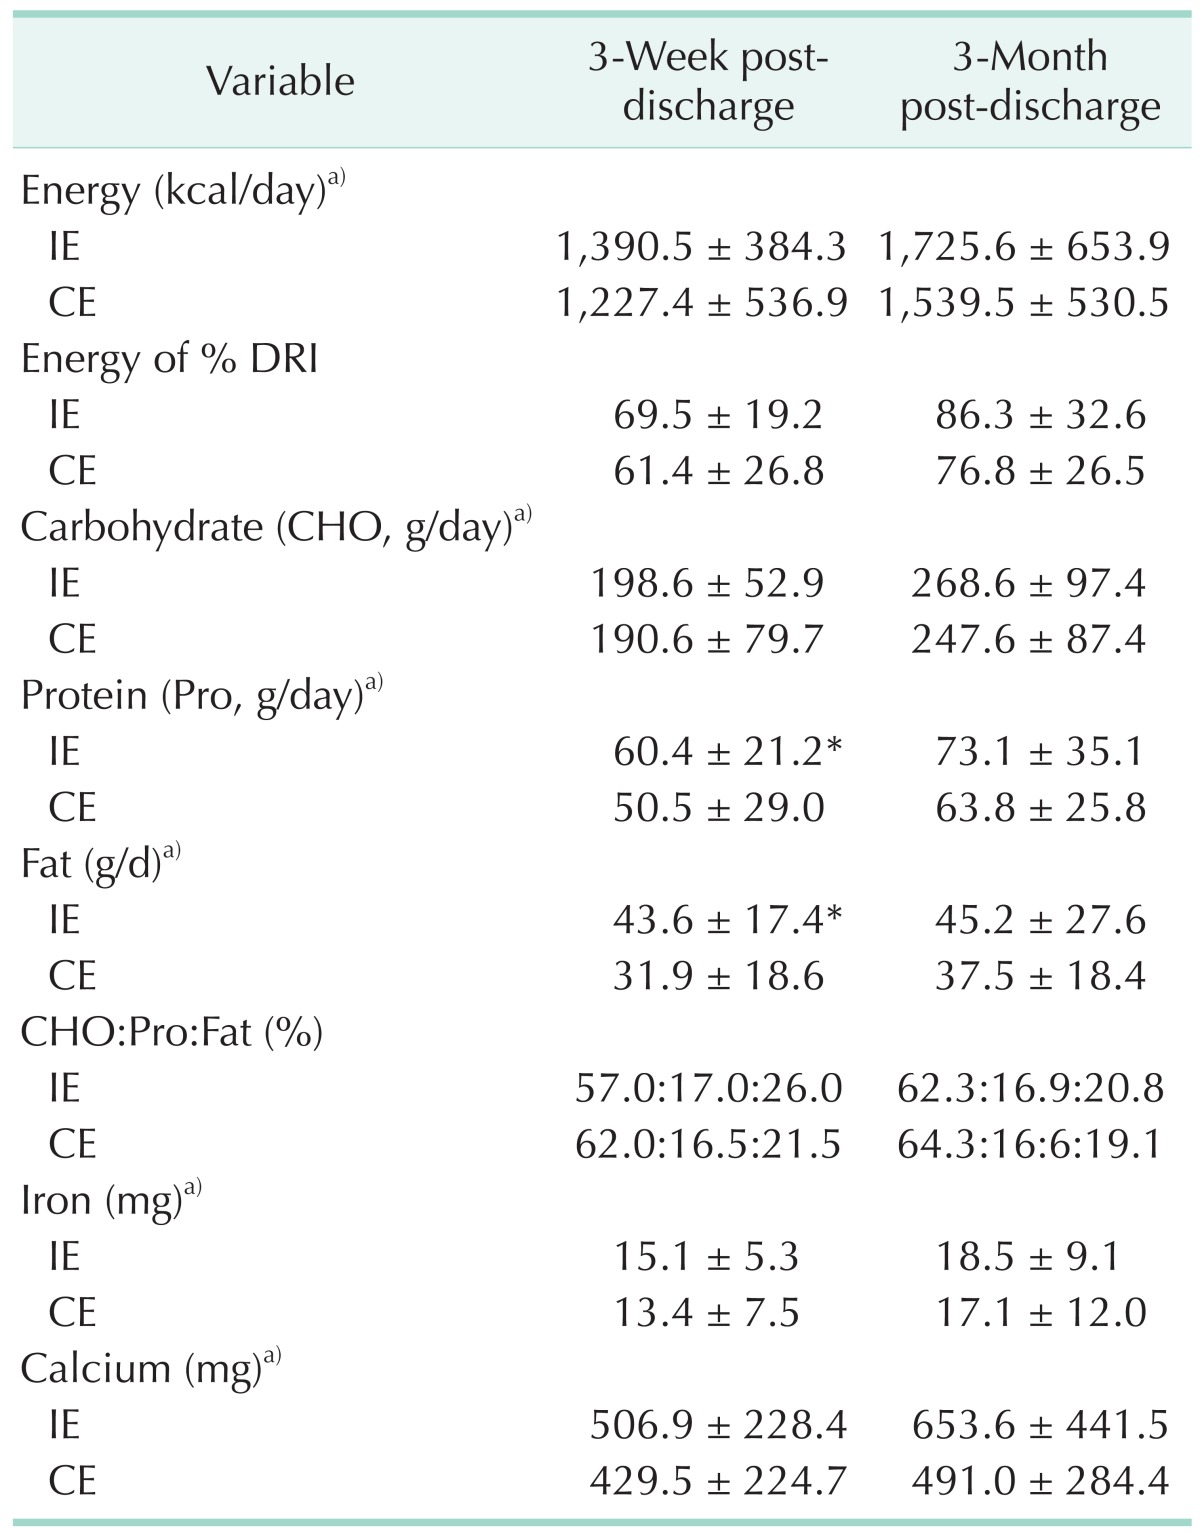
Table 4. Intake of nutrients between intensive and conventional education groups.
Values are presented as mean ± standard deviation unless otherwise indicated.
IE, intensive education group; CE, conventional education group; DRI, dietary reference intakes.
*Significantly different at P < 0.05 between the two groups by the Mann-Whitney test. a)Significantly different at P < 0.001 within each group by the Friedman test

