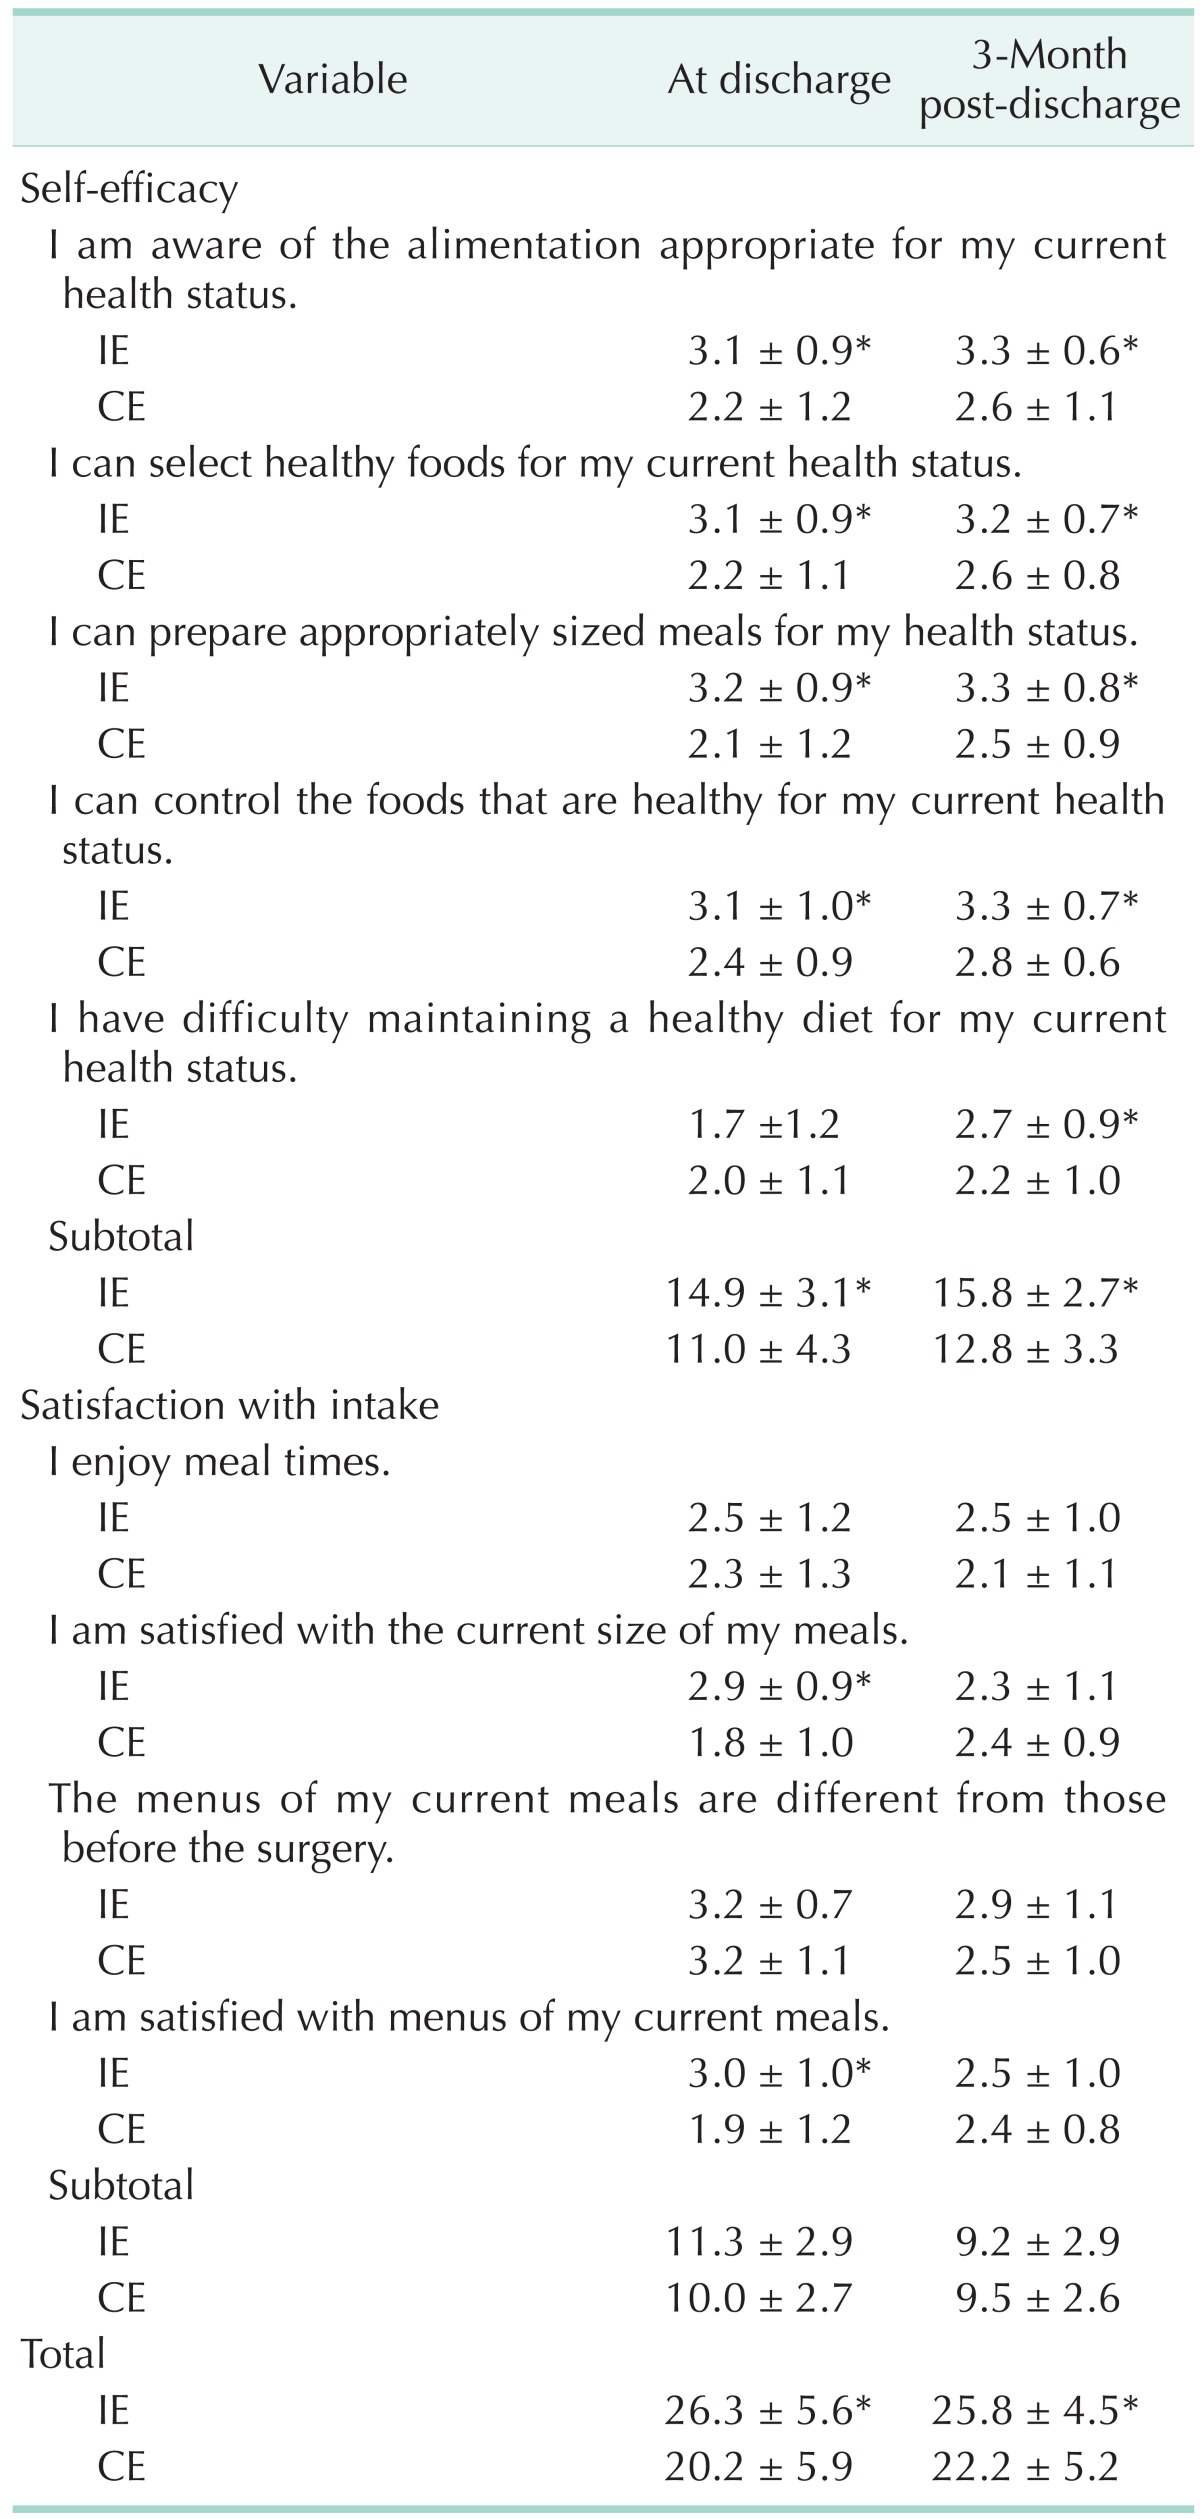
Table 5. Self-efficacy and satisfaction with intake-related quality of life between intensive and conventional education groups.
Values are presented as mean ± standard deviation.
CE, conventional education group; IE, intensive education group.
Subjects were asked to respond on a 5-point scale ranging from 1 (strongly disagree) to 5 (strongly agree).
*Significantly different at P < 0.05, P < 0.001 between group by the Mann-Whitney test.

