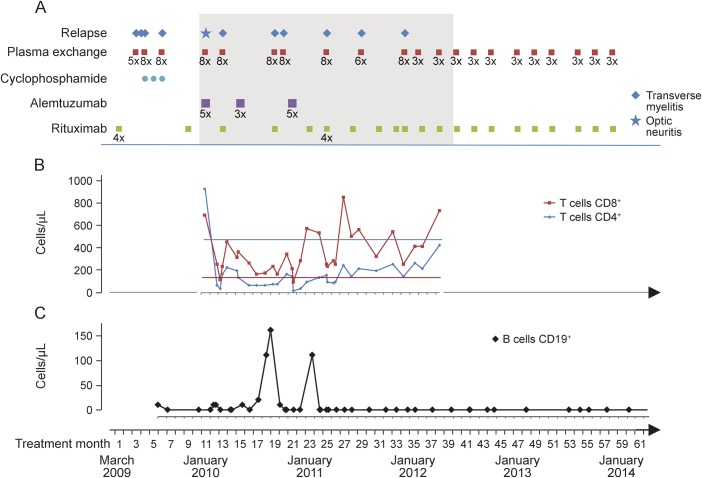
Figure. Clinical course, treatment, and lymphocyte populations.
(A) Clinical course and treatment between March 2009 and January 2014. The period of alemtuzumab treatment is shaded. (B) CD4+ and CD8+ T cells in the peripheral blood during and after alemtuzumab treatment between January 2010 and April 2012. Flat lines indicate the lower limit of normal. (C) CD19+ B cells in peripheral blood.

