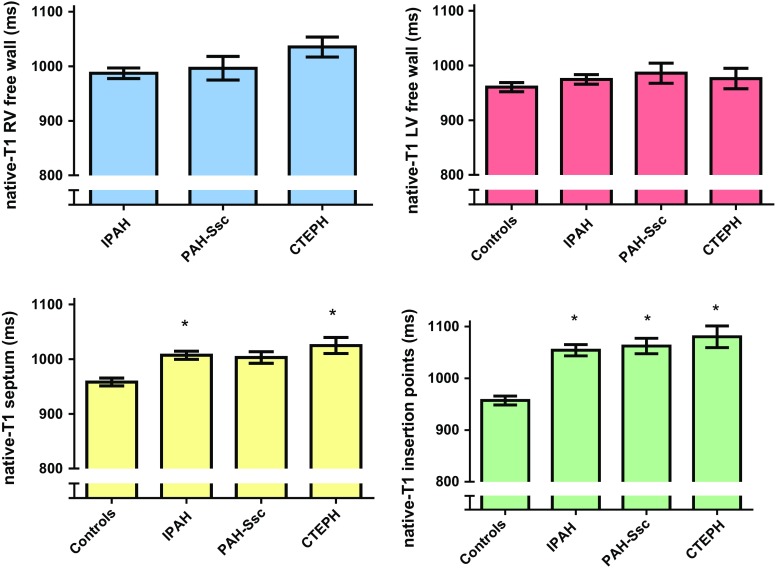
Fig. 5.
Comparison of native T1-values between IPAH, PAH-SSc and CTEPH patients and control subjects. Data is presented as mean and standard error of the mean. The Y-axis Native T1-values of the RV free wall (blue), LV free wall (red), interventricular septum (yellow) and interventricular insertion regions (green) were not significantly different between IPAH, PAH-SSc and CTEPH patients. Native T1-values of the LV free wall was not significantly different between control subjects and PH patients. Native T1-values of the interventricular septum was significantly higher in IPAH and CTEPH patients compared to control subjects. Native T1-values of the interventricular insertion regions were significantly increased in all PH categories compared to control subjects

