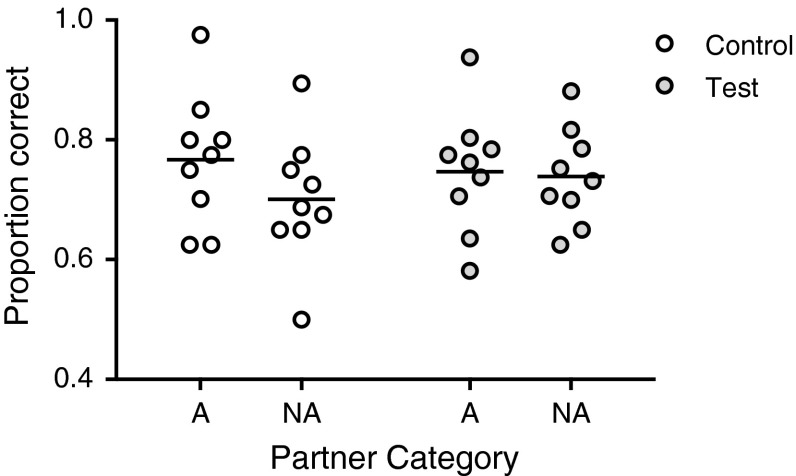
Fig. 6.
Comparison of social control and feedback conditions. Individual mean proportion correct responses in the social control (open circles) and the experimental feedback conditions (light grey circles) separately for sessions with an affiliate (A) and a non-affiliate (NA) present as co-actor. Bars indicate overall means per condition

