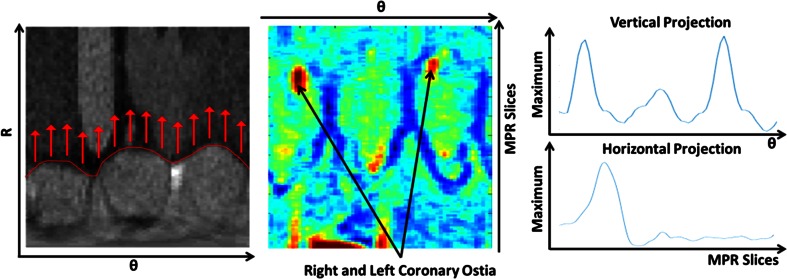
Fig. 4.
(Left) Aortic root image in polar coordinates. The aortic root boundary is shown in red. The arrows represent the direction for which an average intensity projection images is created (Center). The projection image is displayed in the middle showing the two local maxima representing the coronary ostia. Two 1-D maximum projection curves were calculated (Right) to determine the proximal–distal and angular locations of the coronary ostia

