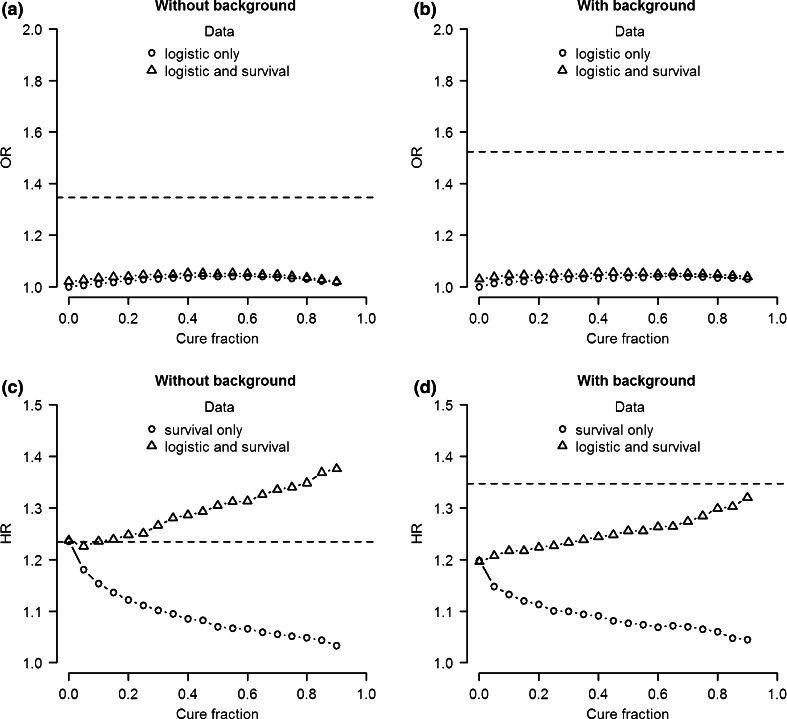
Fig. 3.
Median effect size estimate of 10,000 simulations as a function of cure fraction for logistic (a, b) and Cox PH analysis (a, b). Left plots simulation data without background heritability. Right plots simulation data with 50 % background heritability for both logistic and survival effect. The horizontal line represents the simulated effect size

