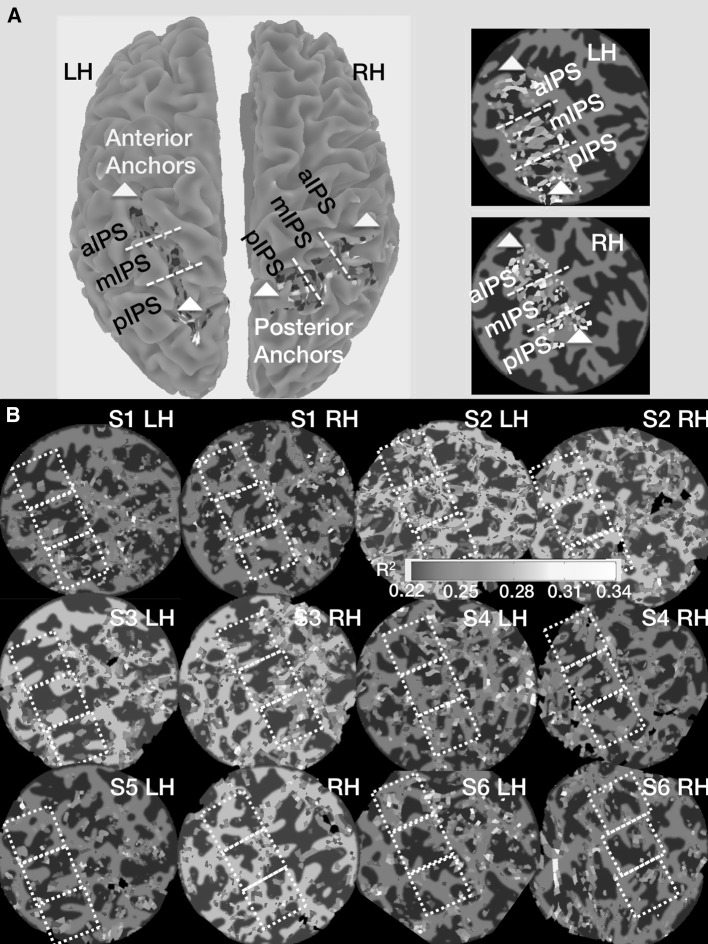
Fig. 2.
GLM-based maps show the ROI location on the surface and threshold variance-explained (R 2) maps for single scan sessions. a The dorsal surface of the left (LH) and right (RH) cerebral hemispheres. We first used the mrTools software GLM-based analysis that allows us to selectively show activation within our three regions of interest (ROIs) (see “Methods” section). This is used to ascertain that ROIs included the IPS and is distinct from the slow event-related analysis. It is clear from this representative drawing that our ROIs captured the full extent of the IPS, from the most posterior point (white anchor point) at the junction of the parieto-occipital and IP sulci to the most anterior IPS at the junction of the post-central and IPS (yellow anchor point). The flat maps to the right side of the surface map in a shows the equidistant parsing procedure used. Briefly, we drew two lines that partitioned the IPS based on the above anchor points into three equal-sized zones from back to front (pIPS, mIPS and aIPS, respectively). b The data from the single scan session displayed on each participant’s flattened surface representation (R 2 > 0.22 or at least 22 % of the variance is accounted for by the model). As can be seen, there is activation distributed along both the inferior (BA7) and superior (BA5) portions of the parietal lobule. Although 11 scan sessions are included, we only show one session for each participant (although all but one of the 12 sessions collected demonstrated activation in each and every ROI)

