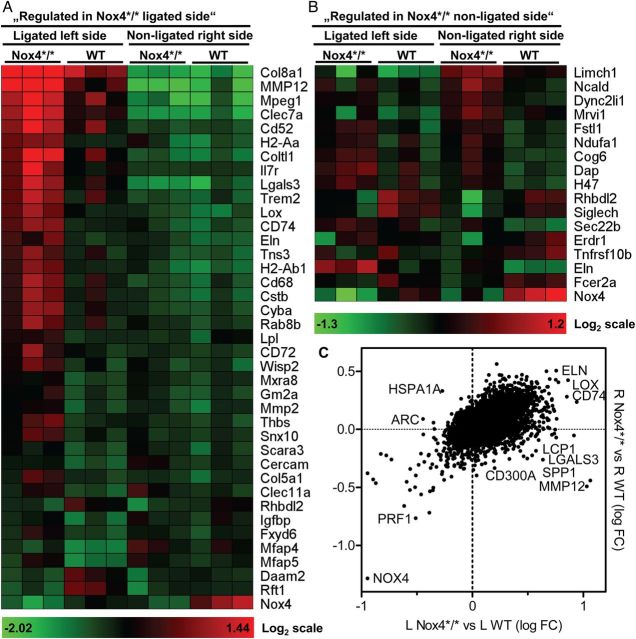
Figure 4.
Carotid gene expression of ApoE−/− mice 7 days after ligation. Illumina MouseWG-6 v2 BeadChip array. L indicates operated left side, R indicates non-operated control side, n = 5. (A) Log2 normalized heat map of selected genes (ligated, >1.5-fold, P < 0.1) in Nox4*/* compared with WT. (B) Log2 normalized heat map of selected genes (non-ligated, >1.3-fold, P < 0.1) in Nox4*/* compared with WT. (C) Dot plot displaying relative expression level of genes in operated left (L) and control right (R) carotids of Nox4*/* and WT mice. Values are the ratios of Log10 normalized fold change.

