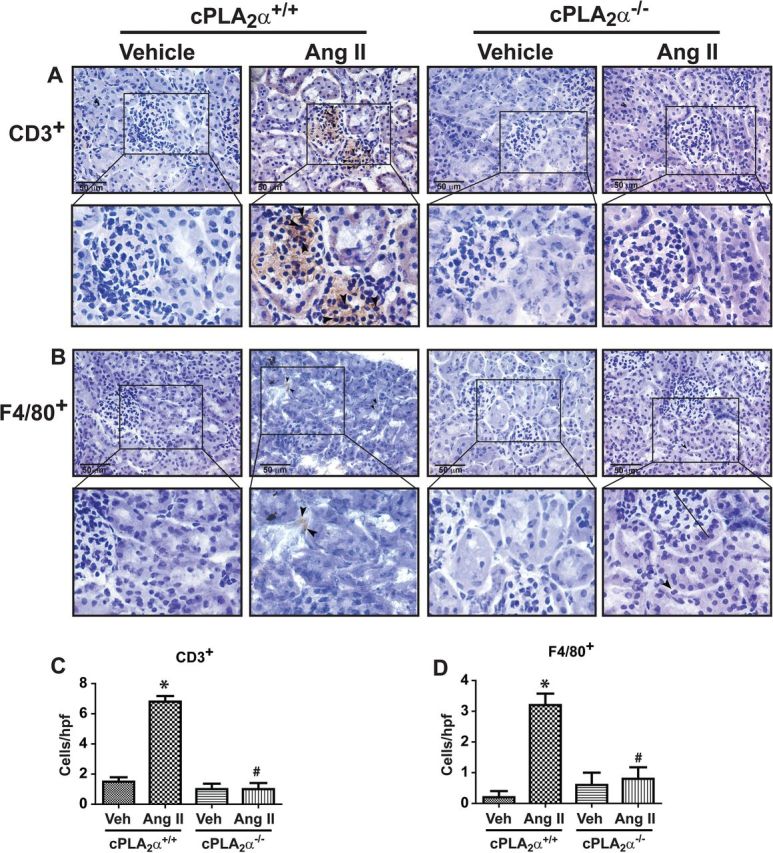
Figure 3.

cPLA2α gene disruption prevents renal inflammation. CD3+ T cell (A) and F4/80+ macrophages (B) in glomerulus of the kidney, as determined by immunohistochemical analysis. Panels (C) and (D) represent quantified data as cells/high power field (hpf). *P < 0.05 cPLA2α+/+ vehicle vs. cPLA2α+/+ Ang II, # P < 0.05 cPLA2α+/+ Ang II vs. cPLA2α−/− Ang II (n = 4 for each group, data are expressed as mean ± SEM).
