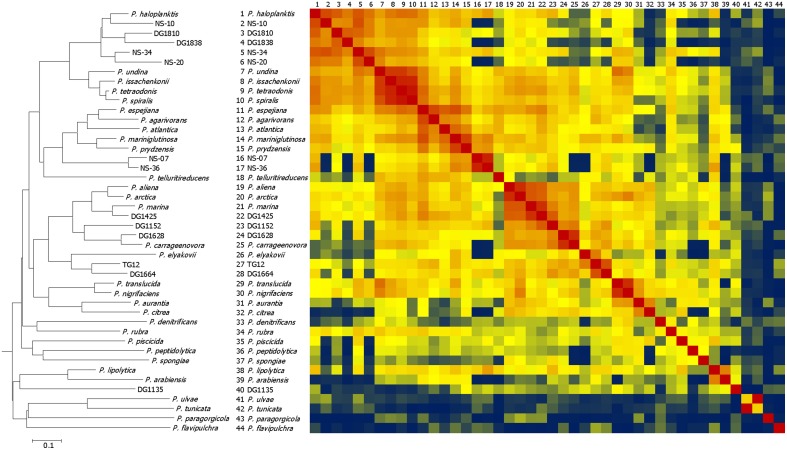
Figure 1.
Dendrogram and heat map comparing MALDI-TOF mass spectra of Pseudoalteromonas type strains and environmental isolates. The heat map represents the distance matrix generated by using Biotyper software composite correlation index (CCI) analysis. The dendrogram was generated from the distance matrix using the neighbor joining method. In the heat map red represents the highest similarity, yellow represents the 50th percentile of similarity, and blue represents the lowest similarity. The isolates are ordered in the same way on the heat map as on the dendrogram. Numbers on the top of the heat map correspond to those on the side.

