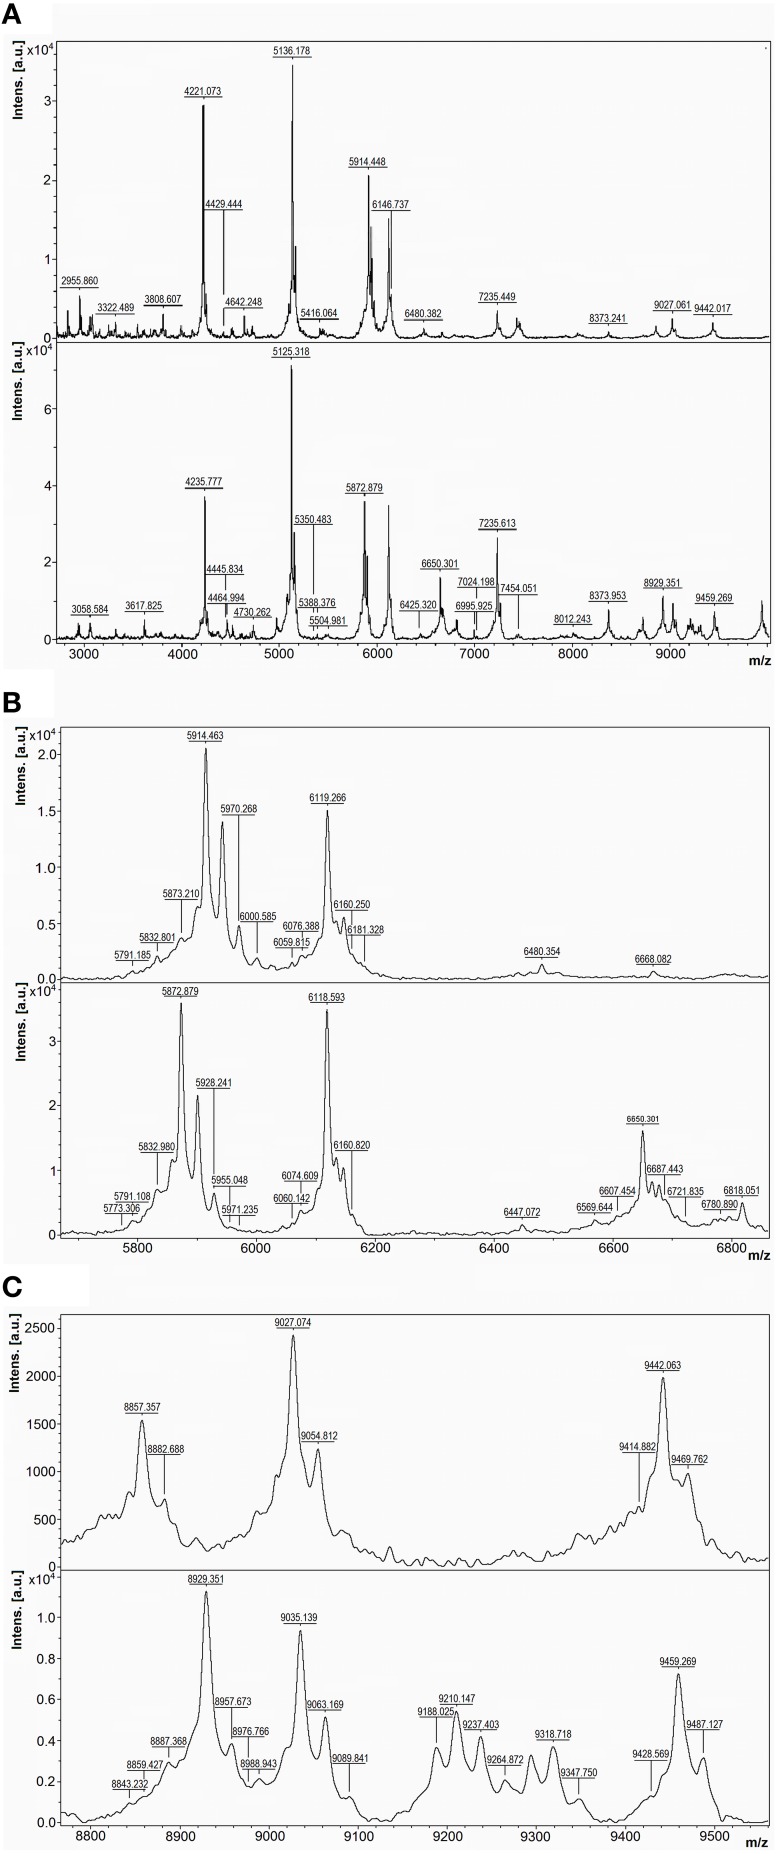
Figure 3.
Comparison of MALDI-TOF mass spectra of P. tunicata and P. ulvae. Top, P. tunicata DSM14096; bottom, P. ulvae DSM15557. (A) Mass spectra of the two type strains at m/z 2800-10,000, where the most peaks are. (B) Zoomed mass spectra showing peak shifts at m/z 5800–6000 and discriminative peaks at m/z 6400–6900. (C) Zoomed mass spectra showing discriminative peaks at m/z 8800–9500.

