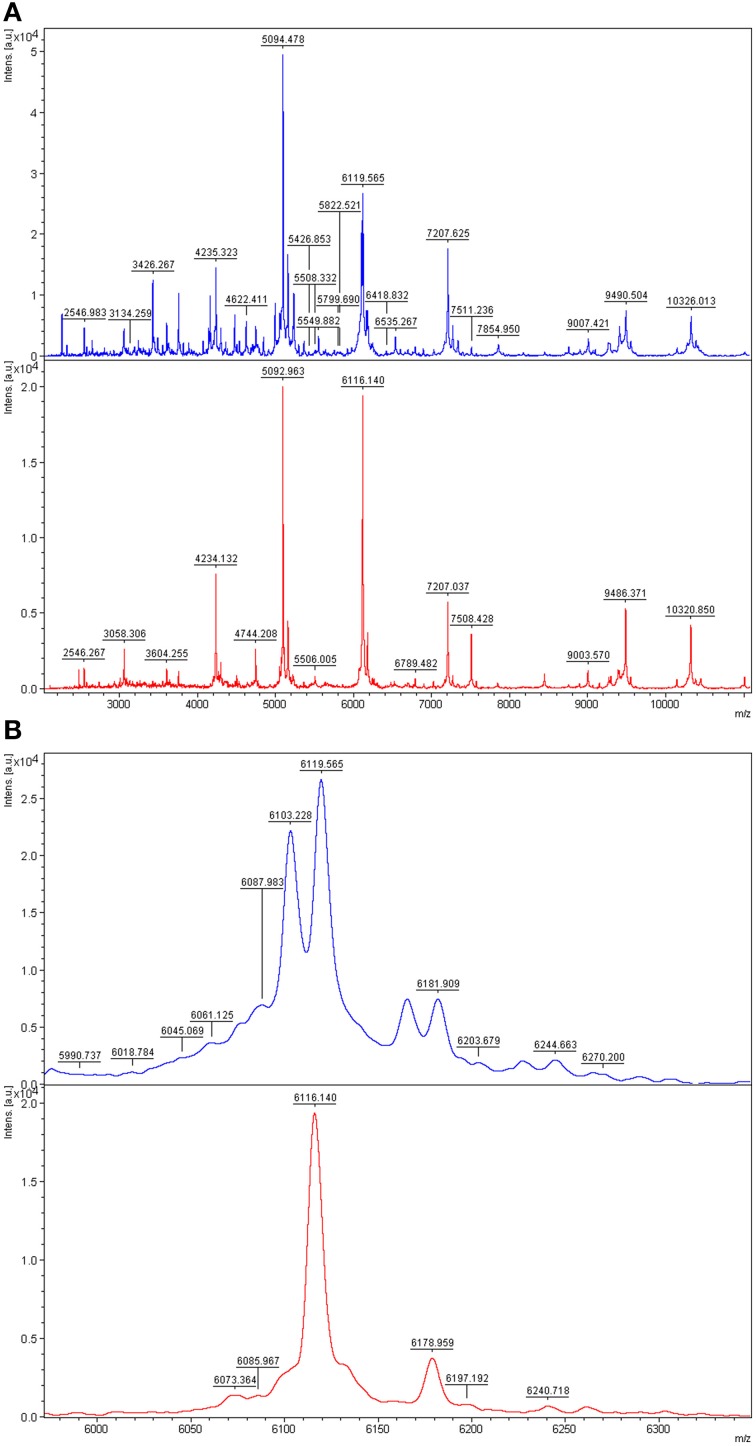
Figure 4.
Comparison of MALDI-TOF mass spectra of P. aurantia and P. citrea. Top, P. aurantia DSM6057; bottom, P. citrea DSM8771. (A) Mass spectra of the two isolates at m/z 2000–11,000, where the most peaks are. (B) Zoomed mass spectra showing discriminative peaks at about m/z 6103 and 6160 in the P. aurantia spectrum.

