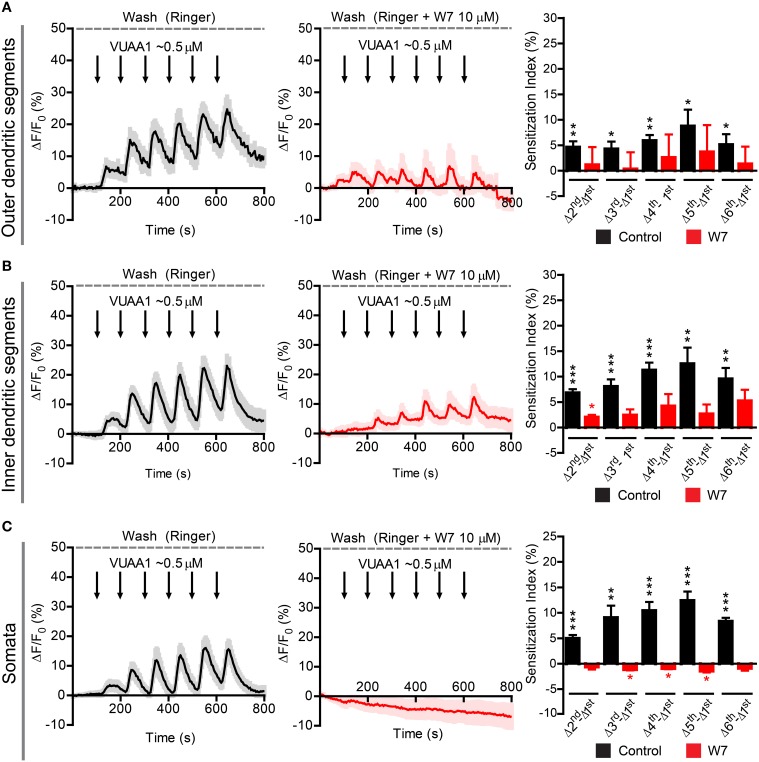
Figure 6.
Sensitization in different compartments of Or22a OSNs stimulated with VUAA1 in absence or presence of the strong calmodulin inhibitor W7. ΔF/F0 (%) over time recorded in control conditions (left panels, black) and in presence of 10 μM W7 (middle panels, red) in the: (A) ODSs of the neurons (left, n = 8 from 5 antennae; middle n = 3 from 3 antennae), (B) IDSs of the neurons (left, n = 12 from 7 antennae; middle, n = 4 from 2 antennae), (C) Somata of the neurons (left, n = 17 from 6 antennae; middle, n = 4 from 4 antennae). Right panels show the Sensitization Index (%), calculated as described in Figure 5C, in control conditions (black) and in presence of W7 (red) quantified for the Outer dendritic segments (A), the Inner dendritic segments (B), and the Somata (C); one-sample t-tests (μ0 = 0, representing no sensitization event), ***p < 0.001, **p < 0.01, *p < 0.05. All graphs represent mean ± SEM values.

