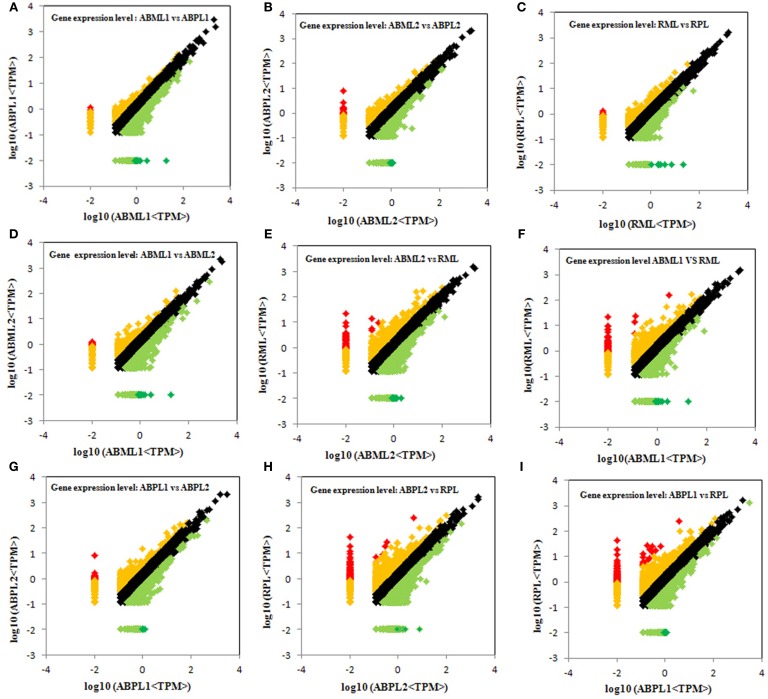
Figure 4.
Comparison of gene expression levels across all libraries. All genes mapped to the reference sequence were examined for differential expression across the libraries. ABML1 and ABPL1: apical bud of 3–4-leaf stage of monoecious and female lines, respectively; ABML2 and ABPL2: apices of 5–7-leaf stage of monoecious and pistillate lines; RML and RPL: small raceme (2–3 cm long) of monoecious and female lines. Red prism represented significantly up-regulated genes (log2Ratio, ≥1; probability, ≥0.8), yellow represented up-regulated genes (log2Ratio, ≥1; probability, <0.8), black showed not DEGs (log2Ratio, ≥0 and <1), light green indicated down-regulated genes (log2Ratio, ≤ −1; probability, <0.8) and green prism demonstrated significantly down-regulated genes (log2Ratio, ≤ −1; probability, ≥0.8).

