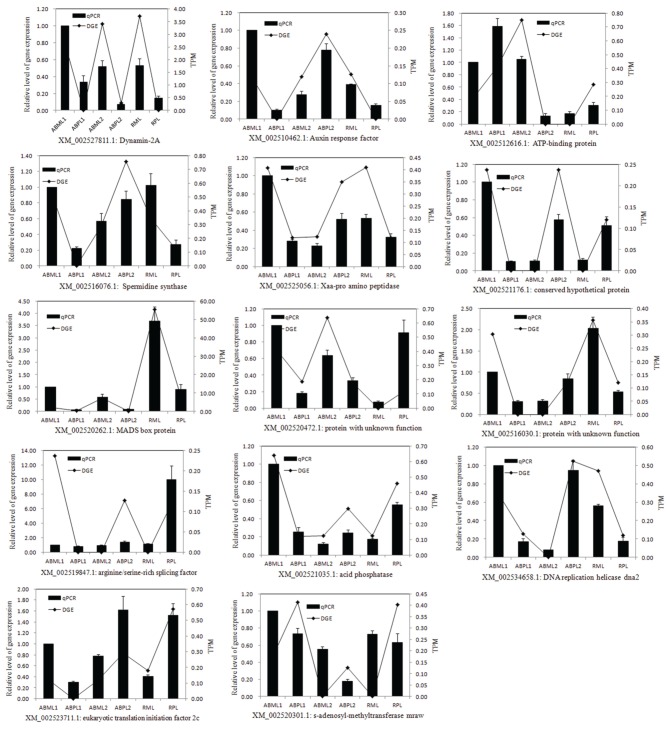
Figure 7.
Quantitative RT-PCR validation of differential expressed genes. TPM, Transcription per million mapped reads. ABML1 and ABPL1, apical buds at 3–4-leaf stage of monoecious and pistillate lines; ABML2 and ABPL2, apical buds at 5–7-leaf stage of monoecious and pistillate lines; RML and RPL, infant raceme stage of monoecious and female lines. Relative expression levels were calculated using Actin as an internal control. Error bars indicate SE (n = 3).

