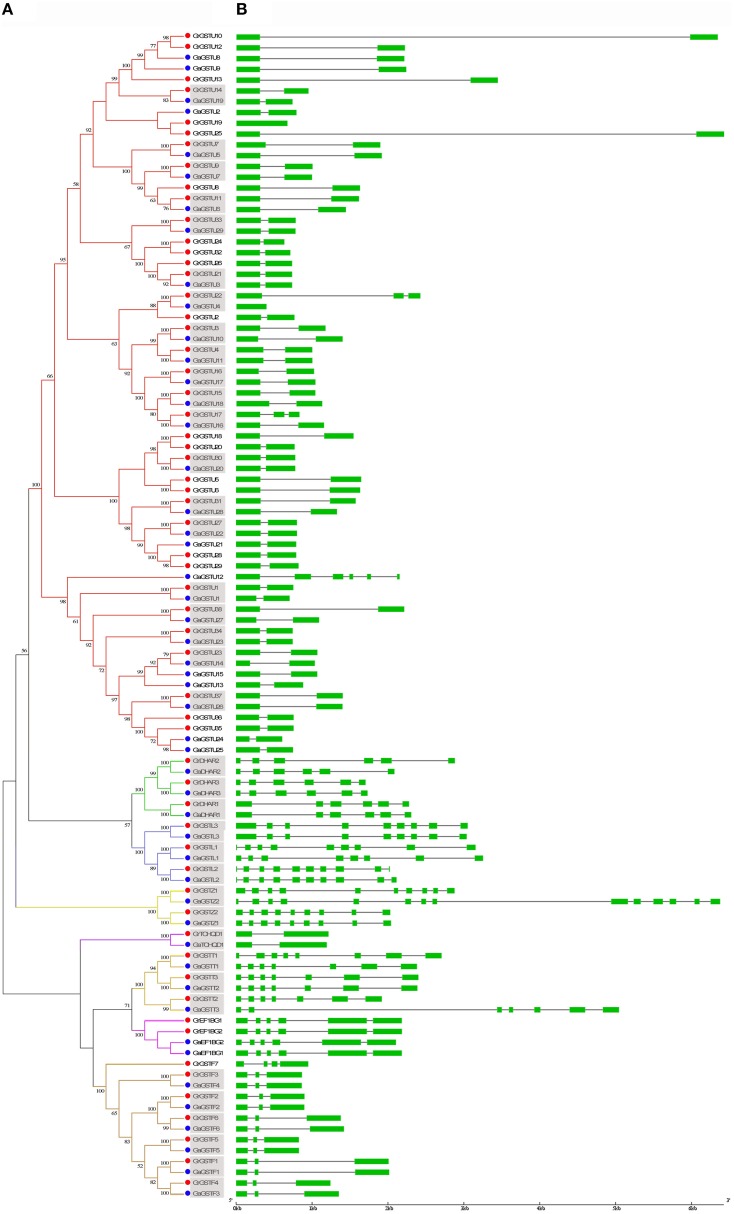
Figure 3.
Phylogenetic relationships and gene structure of GST genes from G. raimondii and G. arboreum. (A) The phylogenetic tree of all GST genes in G. raimondii and G. arboreum was constructed using MEGA 5.2 by Neighbor-Joining method and the bootstrap test was performed with 1000 replicates. Percentage bootstrap scores of >50% were displayed. The GST genes from G. raimondii and G. arboreum were marked with red dots and blue dots, respectively. Gene names in gray background shown orthologous pairs. (B) The exon-inton structure of GST genes from G. raimondii and G. arboreum. Exons were represented by green boxes and introns by gray lines.

