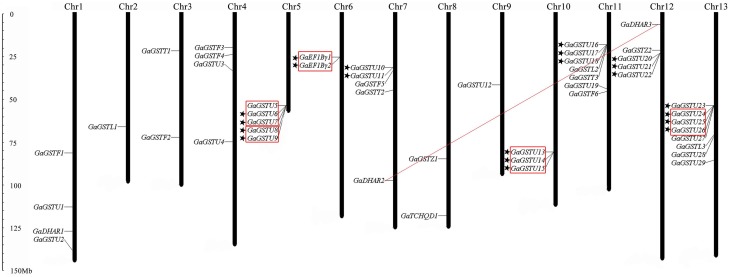
Figure 5.
Chromosomal distribution and gene duplication of GST genes in G. arboreum. The chromosome number was indicated at the top of each chromosome representation. The scale on the left was in megabases (Mb). The genes with a pentagram left represent GST gene clusters. Red outlined boxes represent tandem duplicated genes. And the segmental duplicated gene pairs were connected with red lines.

