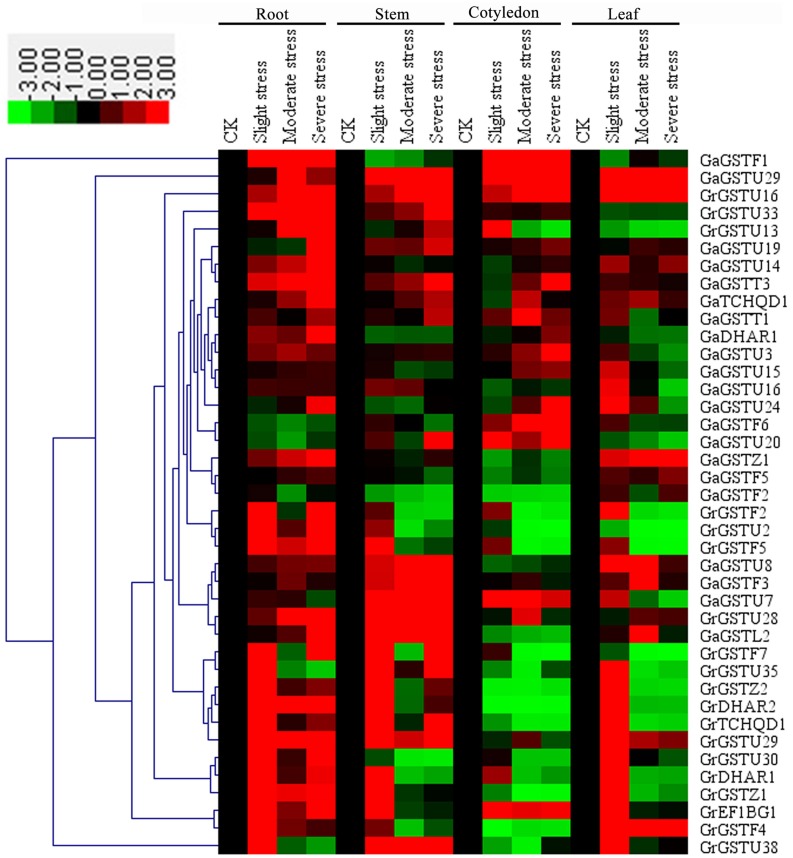
Figure 7.
Expression patterns of 40 selected GST genes in four representative tissues of G. raimondii and G. arboreum under salt stress. The color bar represents the relative signal intensity values. The slight stress, moderate stress, and severe stress represent 50, 100, and 200 mM NaCl in G. raimondii and 100, 200, and 300 mM NaCl in G. arboreum, respectively.

