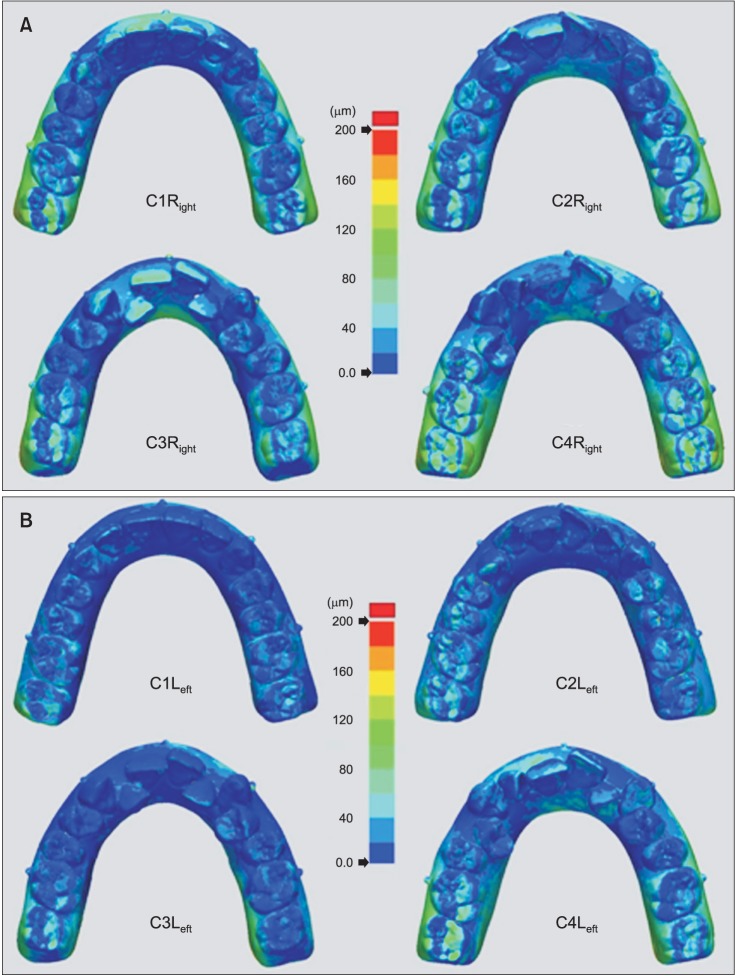
Figure 3. A color presentation of the deviations between surfaces from the iTero® scanner. The color map was set to range from 0 µm to +200 µm. For the models in upper box A (C1Right, C2Right, C3Right, and C4Right), scanning started in the right molar region and then continued on the left side; in lower box B (C1Left, C2Left, C3Left, and C4Left), scanning started in the left molar region and then continued on the right side.
C1, Ideal arch dentition; C2, mildly crowded dentition; C3, moderately crowded dentition; C4, severely crowded dentition.

