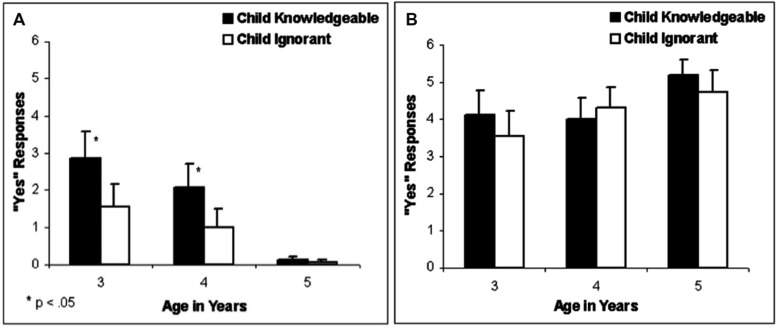
FIGURE 1.
Results from the knowledge assessment task used in Birch and Bloom (2003). Y axis reflects the mean number of ‘yes’ responses to the question ‘Does Percy know what is inside this toy?’ across six trials. That is, the Y axis shows the mean number of times that the participants indicated that Percy would know what is inside the toy. (A) Shows the results for toys that Percy had not seen before. (B) Shows the results for toys that Percy had seen before. Black bars illustrate the performance of children who saw inside the toy (child knowledgeable), and white bars illustrate the performance of children who did not see inside the toys (child ignorant). The asterisks indicate a significant difference between the child knowledgeable and child ignorant conditions. From Birch and Bloom (2003).

