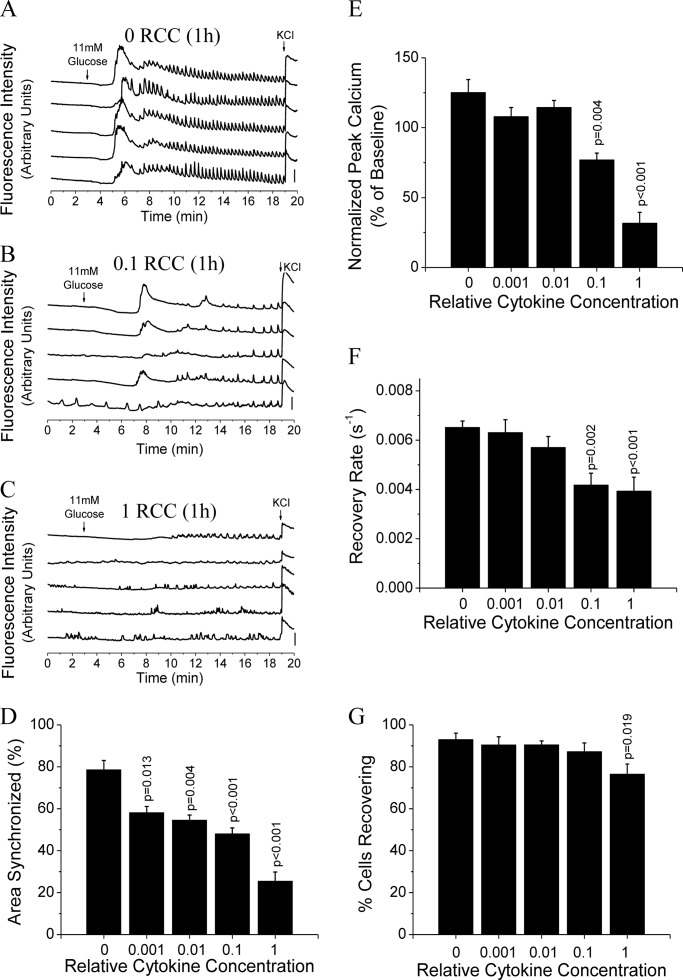
FIGURE 3.
1-h cytokine treatment disrupts [Ca2+]i dynamics and gap junction coupling. A–C, representative traces of [Ca2+]i, as defined by normalized Fluo-4 fluorescence intensity, from 2 mm glucose (0–3 min), to stimulation with 11 mm glucose (3–19 min), and stimulation with 20 mm glucose and 20 mm KCl (19–20 min), from 5 representative cells in 1 islet, treated with 0 (untreated) (A), 0.1 (B), or 1 (C) relative cytokine concentration for 1 h. Bars indicate a 30% change in [Ca2+]i compared with the baseline [Ca2+]i levels. D, relative area of the islet showing synchronized [Ca2+]i oscillations following treatment for 1 h with increasing relative cytokine concentration. E, peak [Ca2+]i levels normalized to baseline [Ca2+]i following cytokine treatment as in D. Data in D and E are averaged over islets from n = 3 mice. F, gap junction coupling, as measured by fluorescence recovery rate during FRAP, following cytokine treatments as in D. G, percentage of cells with measurable levels of gap junction coupling, as defined by showing recovery of fluorescence during FRAP. Data in F and G are averaged over islets from n = 6 mice. Error bars on all panels represent S.E. p values indicate significant differences compared with untreated controls (analysis of variance with Tukey's post hoc analysis, α = 0.05).

