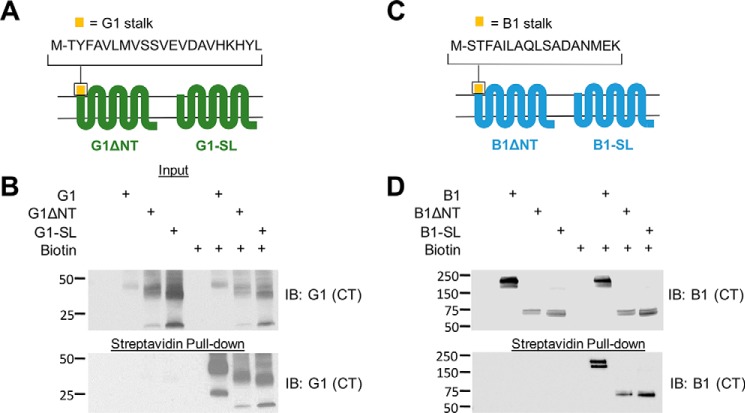
FIGURE 3.
Generation of G1 and B1 SL receptors. A and C, schematic of G1-SL and B1-SL alongside their ΔNT counterparts. B and D, SL mutants exhibit comparable surface expression in HEK cells to their ΔNT counterparts. Molecular weight markers (in kDa) are shown on the left side of the blots. For G1, prominent C-terminally reactive bands between ∼40–45 kDa correspond to monomeric 7TM regions. Lower molecular weight bands at ∼25 kDa (for full-length G1) and ∼20 kDa (for G1-ΔNT or -SL) likely represent further cleaved forms of the proteins and/or differential conformations. Equal amounts of protein (10–20 μg) were loaded in each lane for the blots shown here, and the data shown in this figure are representative of 3–4 experiments for each pair of mutants.

