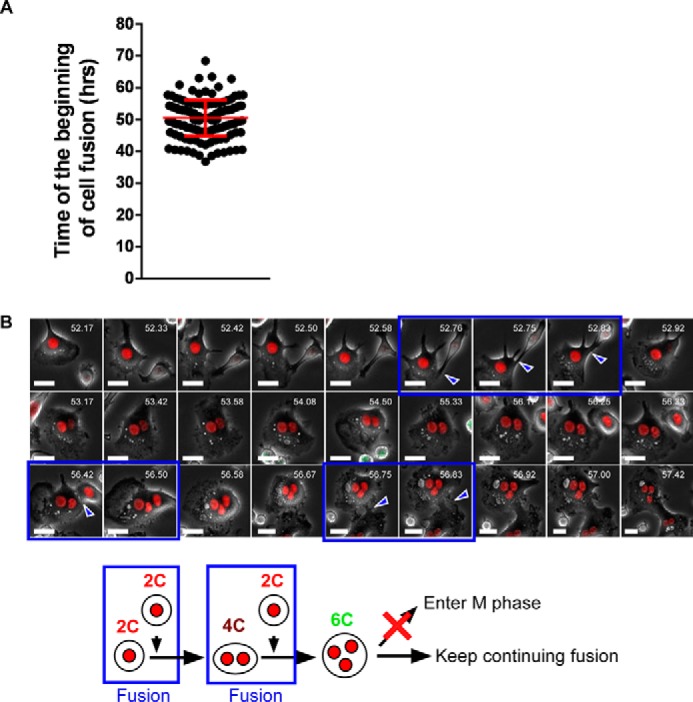
FIGURE 3.

Cell fusion occurs at and after 36 h of RANKL stimulation. A, time of initiation of cell fusion after RANKL stimulation. Images were taken every 5 min, and the time required for cell fusion was calculated. A total of 145 cells that underwent cell fusion are plotted. Red bar indicates means ± S.D. B, representative snapshots of mononucleated cell-cell fusion. Fluorescence and phase-contrast images were taken every 5 min. Blue arrowheads and boxes indicate cell fusion. White numbers in each image indicates time after RANKL stimulation. Bottom schematically depicts the results observed in B. Scale bars, 20 μm.
